
In this week’s episode of Growth@Scale, Matt sits down with Jason Purdy, a product lead at Square for a talk about Go-to-market strategies, product life cycles, and the importance of finding open, unbiased ways of communicating with your customers in order to deliver the best product possible.
Subscribe to Growth@Scale and never miss an episode.
Book a complimentary consultation with one of our experts
to learn how MAVAN can help your business grow.
Want more growth insights?
[hubspot type=”form” portal=”20951211″ id=”9c538ed2-fb12-45f1-a573-ad7953c058cc”]
Related Content
-
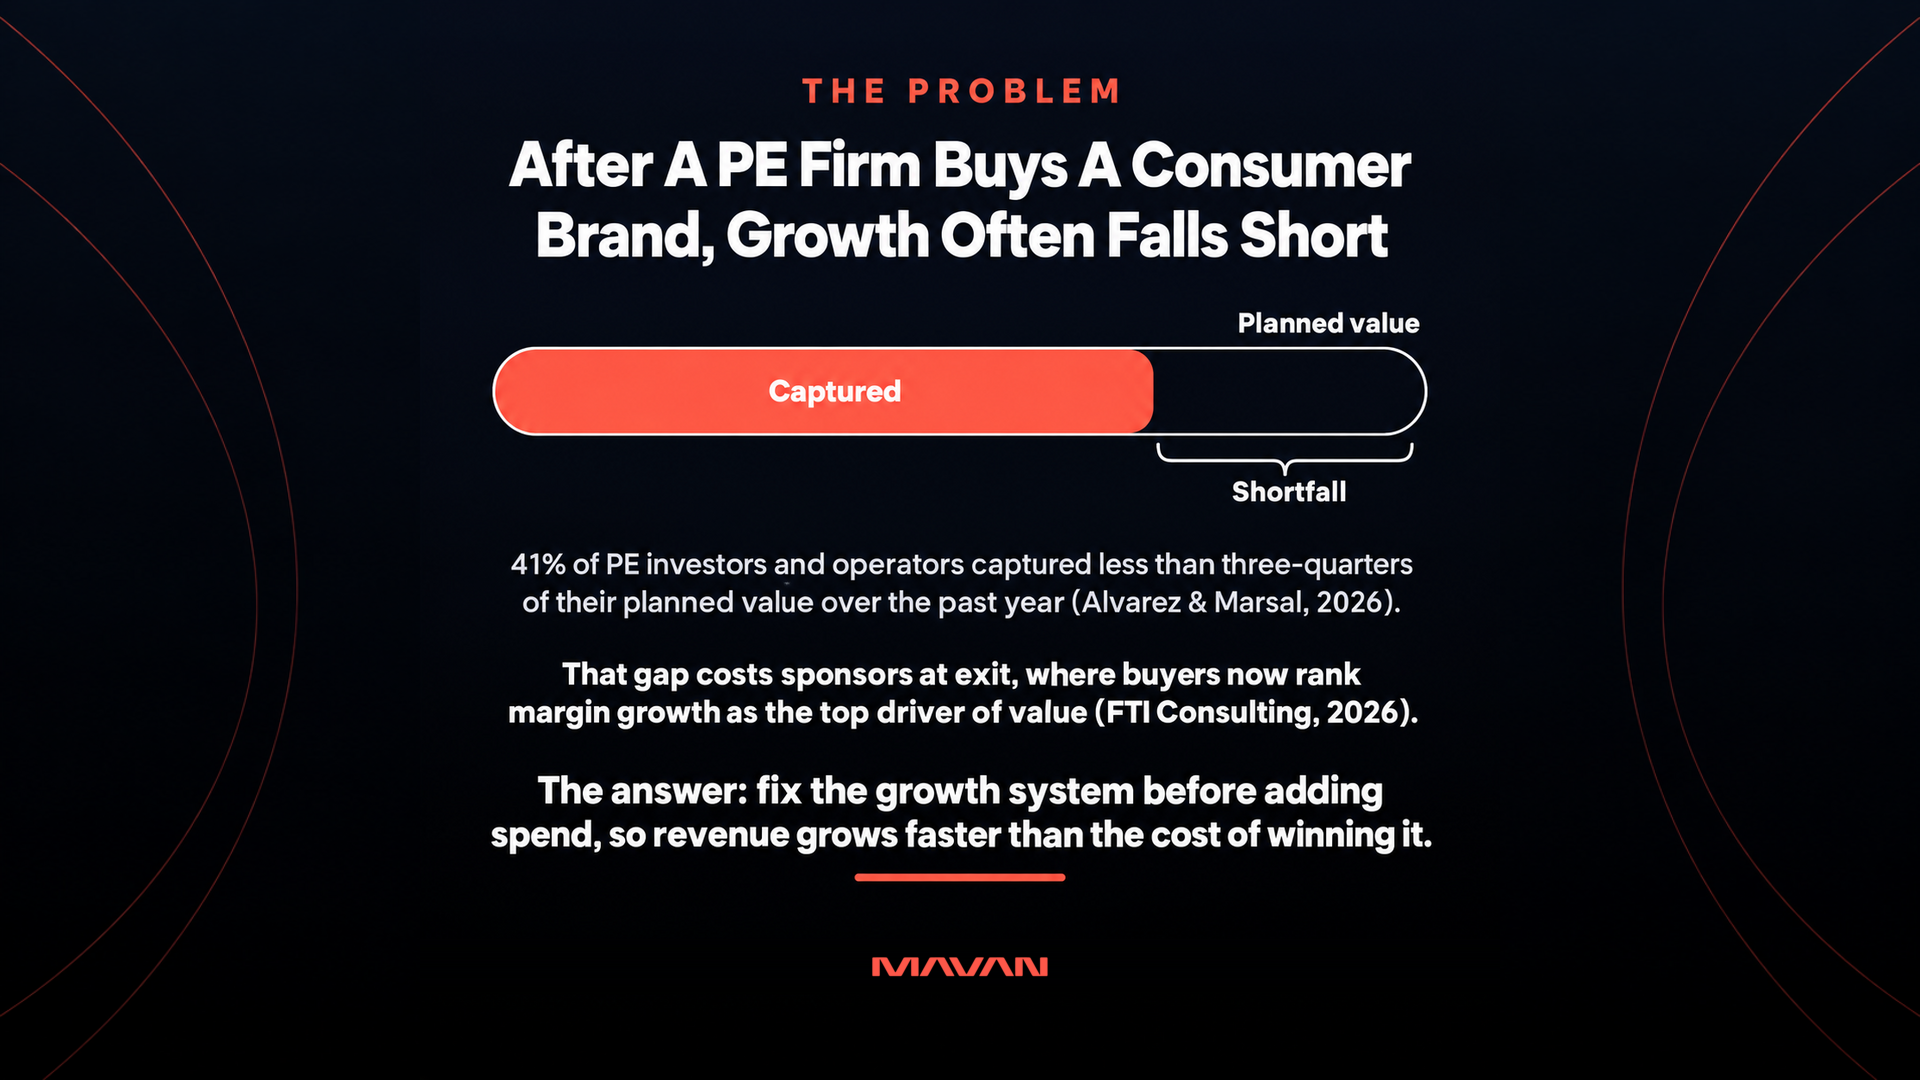
How Do PE Firms Accelerate Revenue And EBITDA Post-Acquisition?
PE firms accelerate revenue and EBITDA at consumer brands by fixing the growth system before adding spend. They reconcile the numbers and cut spend that never pays back. They lift conversion and repeat purchases, and they judge growth by contribution margin. Growth operating partners such as MAVAN diagnose that system in 28 days, then help execute the fix.
-
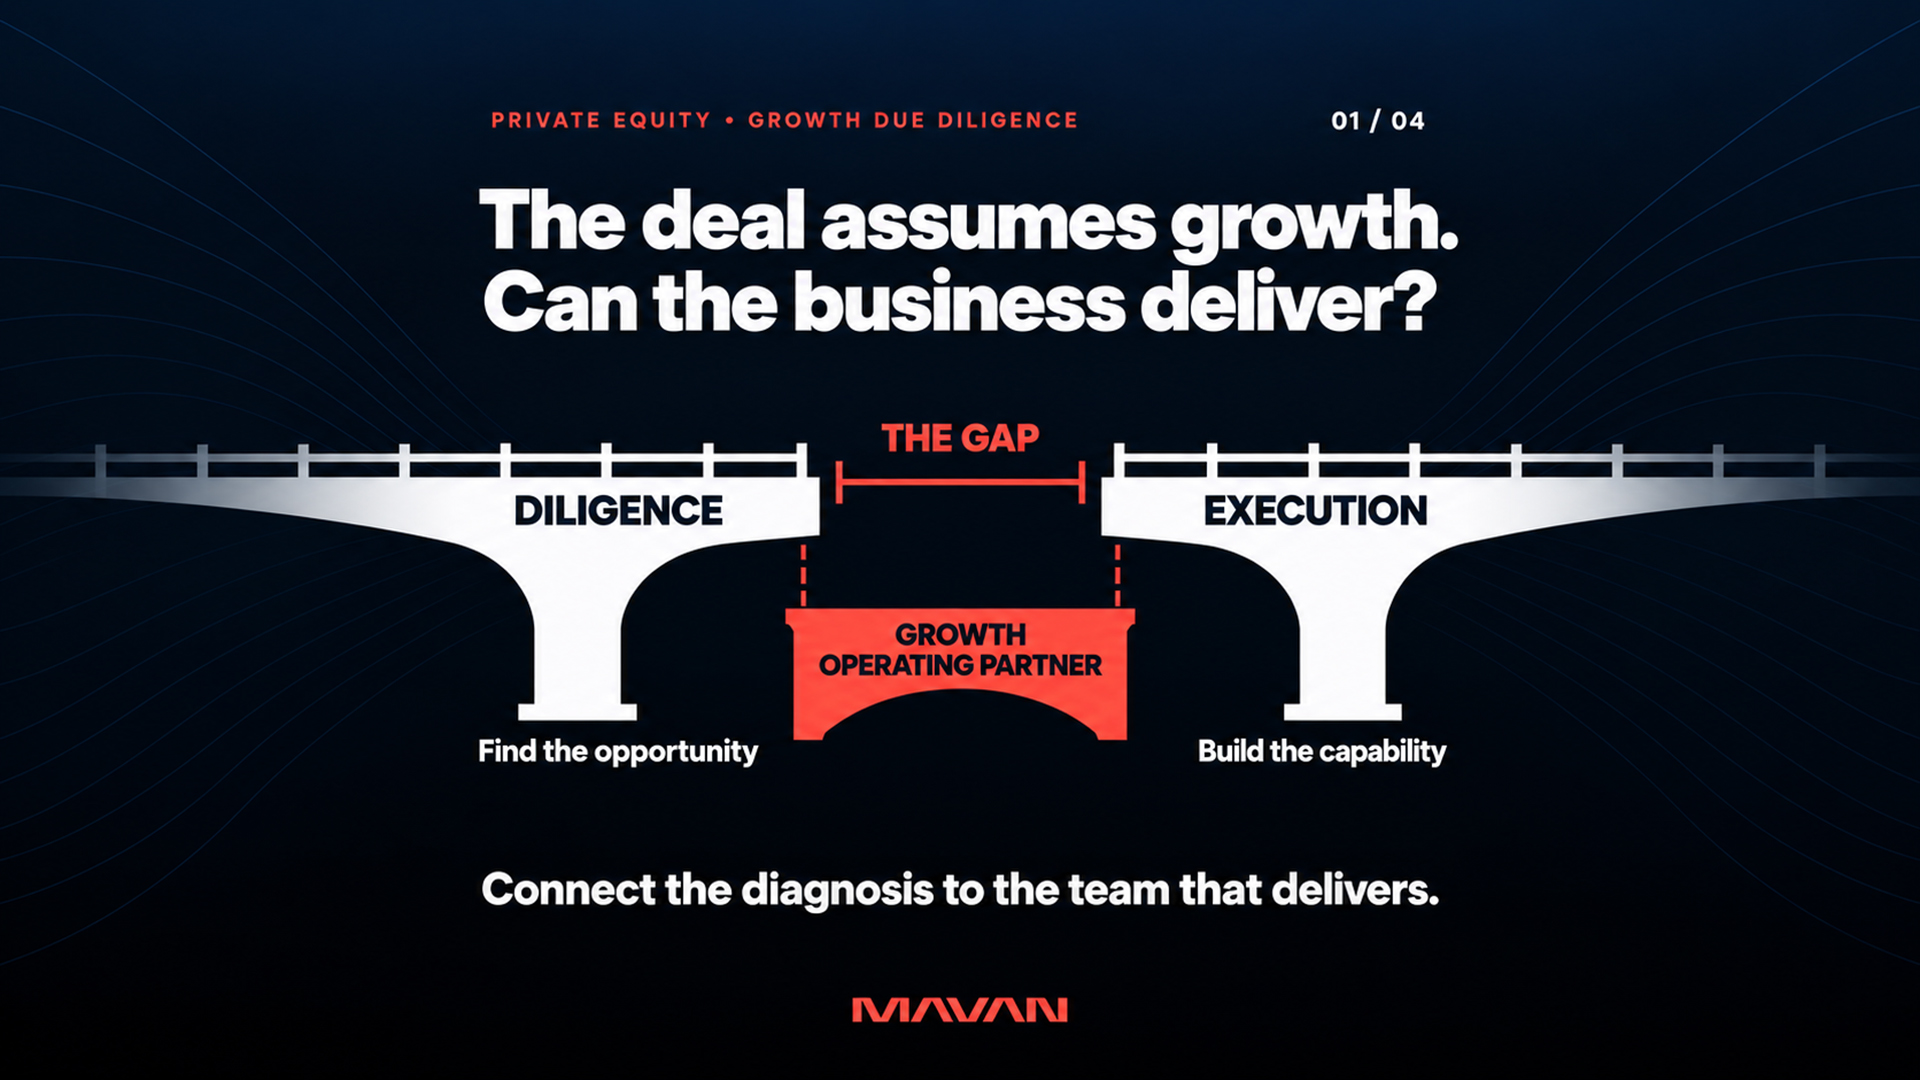
Who Does Growth & GTM Due Diligence for PE Deals?
Four kinds of provider run growth and go-to-market due diligence for private equity deals. Strategy consultancies test the market. Specialist commercial diligence firms audit the pipeline. Go-to-market boutiques rebuild the sales motion. And growth operating partners examine the full revenue engine from inside the business, then stay to operate it after close.
-
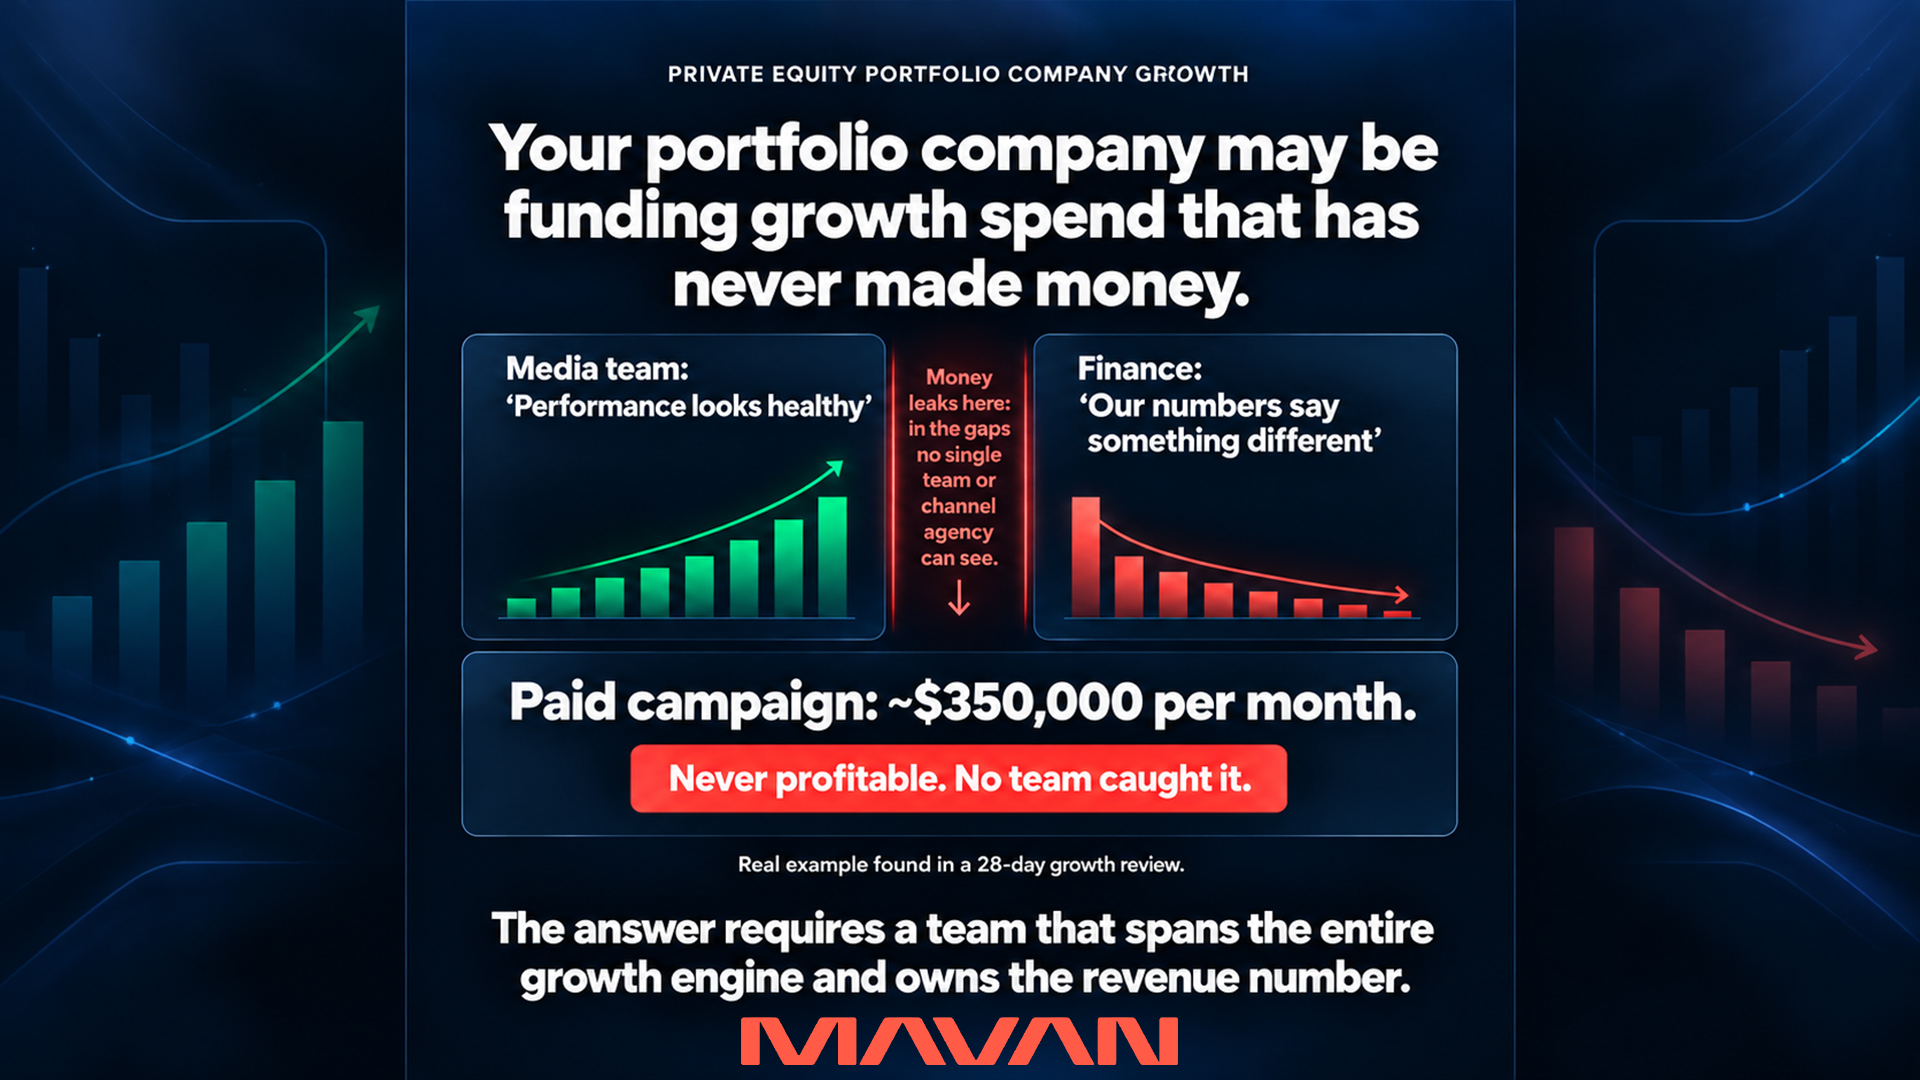
Who Is The Best Growth Partner For PE Portfolio Companies?
The best growth partner for a private equity portfolio company behaves like an operating partner you deploy, not an agency you brief. It reads the whole growth system before it spends, owns a revenue number alongside management, and leaves the capability behind so the sponsor can redeploy it.