
Most teams try to improve their LTV:CAC ratio by cutting acquisition costs. But the higher-leverage fix is raising lifetime value through product changes — better activation, smarter monetization, and stronger lifecycle orchestration — then validating those changes with demand testing before committing engineering time.
TLDR — 10 Critical Insights on LTV and CAC
- Your LTV:CAC ratio is a signal, not a roadmap — it tells you something changed, not where to fix it.
- Always look underneath the ratio: track payback window trends, cohort LTV curves, retention by segment, and marginal CAC by channel.
- Use gross LTV with platform fees removed, and anchor it to your real payback comfort zone.
- Use fully loaded CAC — include tools, personnel, and the real costs of running growth.
- When the ratio slips, resist the reflex to chase cheaper acquisition — raise LTV instead.
- Start with activation: tighten onboarding, surface “aha” moments earlier, and remove friction on the core action.
- Layer in monetization design (tier upgrades, subscription nudges, live-ops hooks) to raise ARPU without chasing volume.
- Add lifecycle orchestration — segmented, triggered campaigns tied to measurable revenue events.
- Validate every product bet with Demand Testing: mock the feature, drive targeted traffic, run 8–12 interviews, and apply clear go/no-go gates before you build.
- If your LTV:CAC has flatlined and you’re not sure where the fix lives, reach out to MAVAN — we’ll sketch three Demand Tests and a diagnostic you can take to your exec team.
Everyone knows the benchmark. A 3:1 LTV:CAC ratio signals health. Below that, you’re burning cash. Above 5:1, you might be under-investing. But here’s what we’ve learned working inside dozens of growth teams: the ratio is a signal, not a roadmap. It tells you something changed. It does not tell you where to fix it.
What Does Your LTV:CAC Ratio Actually Tell You?
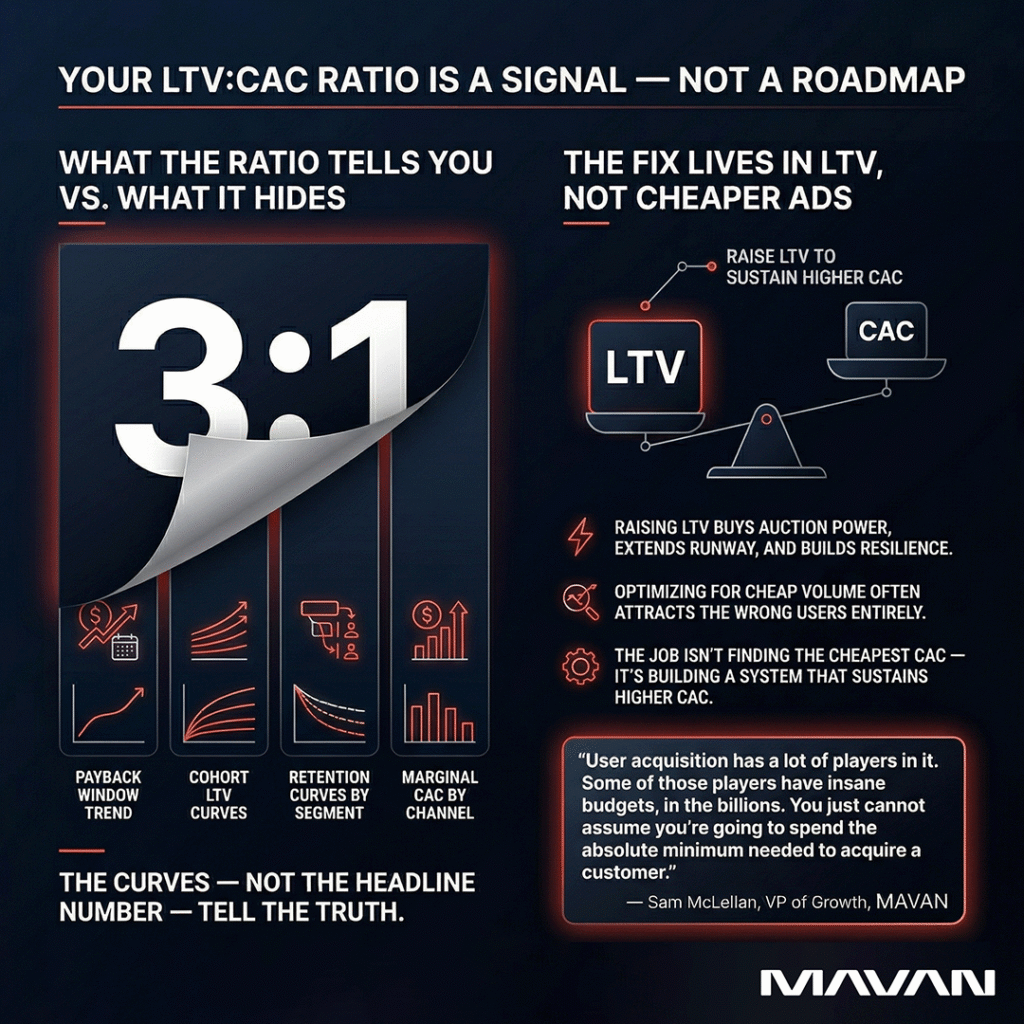
Your LTV:CAC ratio compares the lifetime gross margin of a customer to the cost of acquiring them. It measures whether your growth engine creates or destroys value. But the single number hides critical details about time, shape, and where the pressure lives.
A healthy-looking 3:1 can mask a payback window that’s quietly stretching from six months to fourteen. It can also look weak while your newest cohorts are actually improving — just slowly. Sam McLellan, VP of Growth at MAVAN, has seen teams operate the same way for years, then hit a wall when a platform change breaks their economics overnight. Suddenly, teams realize they can’t explain what happened because “we don’t really have an attribution system that makes sense for us to actually be able to scale this business.”
That’s why we don’t stop at the ratio. We track payback window trends, cohort LTV curves, retention curves by segment, and marginal CAC by channel. The curves — not the headline number — tell us the truth.
Should You Focus on Lowering CAC or Raising LTV?
Both matter — but LTV is the higher-leverage side. Raising lifetime value makes higher CAC survivable. It buys auction power, extends runway, and builds resilience against market shifts you can’t control.
Sam McLellan, VP of Growth at MAVAN, frames the competitive reality clearly: “User acquisition has a lot of players in it. Some of those players have insane budgets, in the billions. You just cannot assume you’re going to spend the absolute minimum needed to acquire a customer.” The job isn’t finding the cheapest CAC. It’s building a system that sustains higher CAC when the market tightens — and that system lives in LTV.
Yet most teams reflexively chase the CAC side — swapping creatives, testing channels, optimizing early signals. McLellan points out the trap: “Leadership wants the lowest costs, so they anchor on the first numbers platforms show them.” In many businesses, revenue concentrates among a small group of high-value users. Optimizing for cheap volume often attracts the wrong people entirely.
What Product Levers Actually Move Lifetime Value?
Three product levers compound over time to raise LTV — and each one reduces dependence on cheap acquisition.
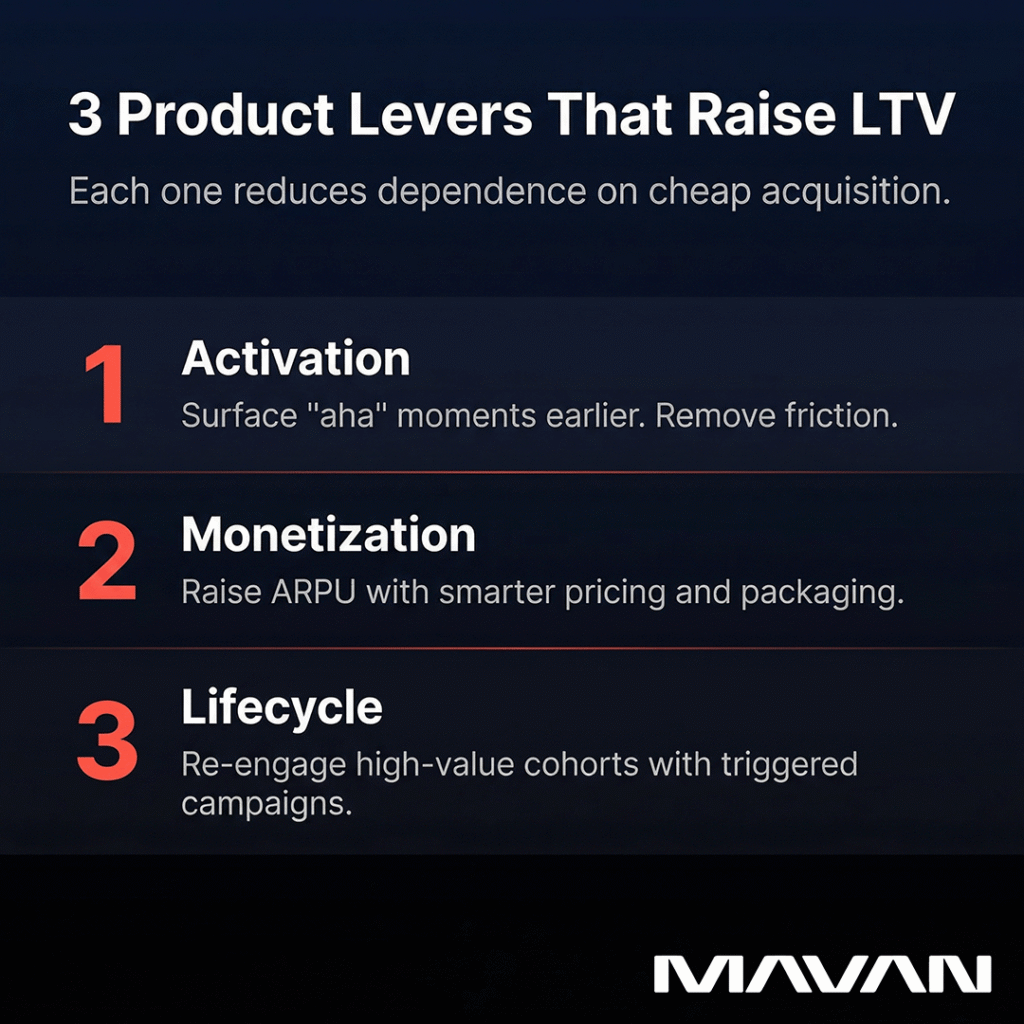
- Activation mechanics: Tighten first-use flows. Surface “aha” moments earlier. Remove friction on the core action. Higher activation increases the share of users who can ever monetize.
- Monetization design: For PLG SaaS, this means tier design and upgrade triggers. For DTC, subscription nudges and margin-aware bundles. For games, store balance and live-ops hooks. Smart monetization raises ARPU (average revenue per user) without chasing volume.
- Lifecycle orchestration: Segmentation, triggered campaigns, and product nudges that re-engage high-value cohorts. The highest-leverage work ties lifecycle touches to measurable revenue events.
These levers behave differently by business model — the nuance matters.
How Do You Validate LTV Improvements Before Building Them?
Every team wants higher LTV. Few can afford to bet engineering time blindly. Demand Testing solves this: advertise a prospective feature, measure top-of-funnel demand, pair it with qualitative interviews, then project downstream economics — before you write production code.
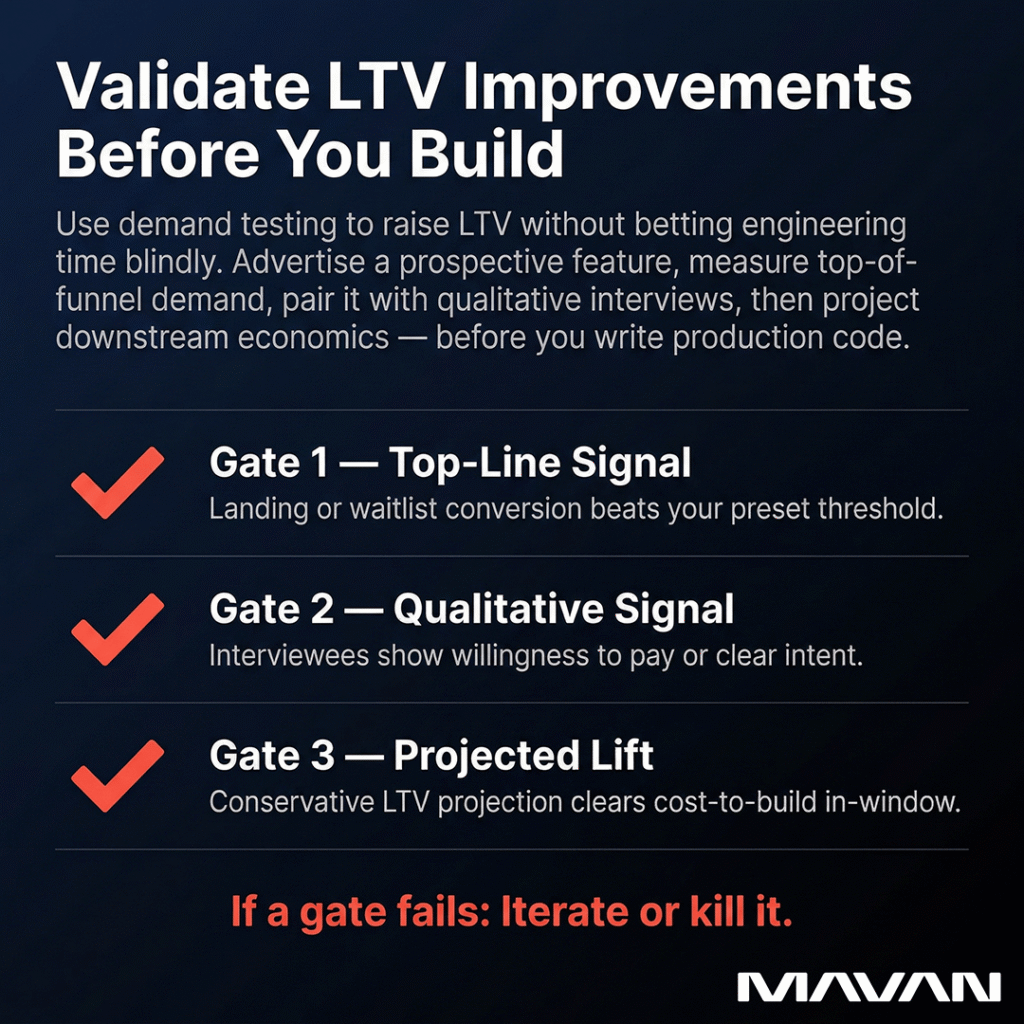
Sam McLellan, VP of Growth at MAVAN, names the bias to watch for: “Especially in startup worlds, everyone wants to assume that everyone wants their product.” That makes rigorous decision gates essential. We use three:
- Top-line signal: Landing or waitlist conversion beats a preset threshold.
- Qualitative signal: Most interviewees show willingness to pay or clear intent.
- Projected lift: Conservative LTV projection beats cost-to-build within a defined payback window.
If a test fails any gate, we iterate or kill it. That discipline saves engineering time and aligns Product, Growth, and leadership around one shared forecast.
Frequently Asked Questions About LTV and CAC
What is a good LTV:CAC ratio for startups?
Most investors use 3:1 as a health benchmark. SaaS companies generally target 3:1 to 5:1, while e-commerce often aims for 2:1 to 4:1. But pair it with payback period, cohort curves, and channel-level marginal CAC to get the full picture.
Which LTV definition should I use?
Sam McLellan, VP of Growth at MAVAN, uses gross LTV with platform fees (like Apple and Google fees) removed, anchored to the company’s real payback comfort zone — because a strong LTV number means nothing if the business can’t wait long enough to collect it.
Should I use fully loaded CAC?
Yes. Sam McLellan advocates for CAC “as fully loaded as you can get it” — including tools, personnel, and real growth costs. It makes the math more painful but protects runway and forces hard calls sooner.
What’s the fastest way to raise LTV?
Start with activation. Small changes to onboarding and first-use flows move the funnel quickly because they increase the share of users who reach monetization. Then layer in monetization design and lifecycle orchestration.
How To Really Improve Your LTV:CAC Ratio
The most durable way to improve your LTV:CAC ratio is to raise LTV through product — not just cut CAC through cheaper ads. Use gross LTV and fully loaded CAC so your math survives scrutiny. Track payback windows, cohort LTV shapes, and retention by segment. Then validate product improvements with Demand Testing before committing engineering resources.
If your LTV:CAC ratio has been flat or declining, then run three Demand Tests in the next 30 days. Pair each with 8–12 qualitative interviews. Ship a one-page readout with cohort LTV curves and a go/no-go recommendation.
Casey Rock is Content Director at MAVAN, where he helps turn complex ideas into clear, strategic content that drives growth. With over 15 years of experience across content strategy, SEO, media, and digital marketing, Casey focuses on building content systems that connect audience insight, brand storytelling, and measurable business outcomes.
Book a complimentary consultation with one of our experts
to learn how MAVAN can help your business grow.
Want more growth insights?
Thank you! form is submitted
[hubspot type=”form” portal=”20951211″ id=”9c538ed2-fb12-45f1-a573-ad7953c058cc”]
Related Content
-
What’s the Best Growth Agency For VC & PE?
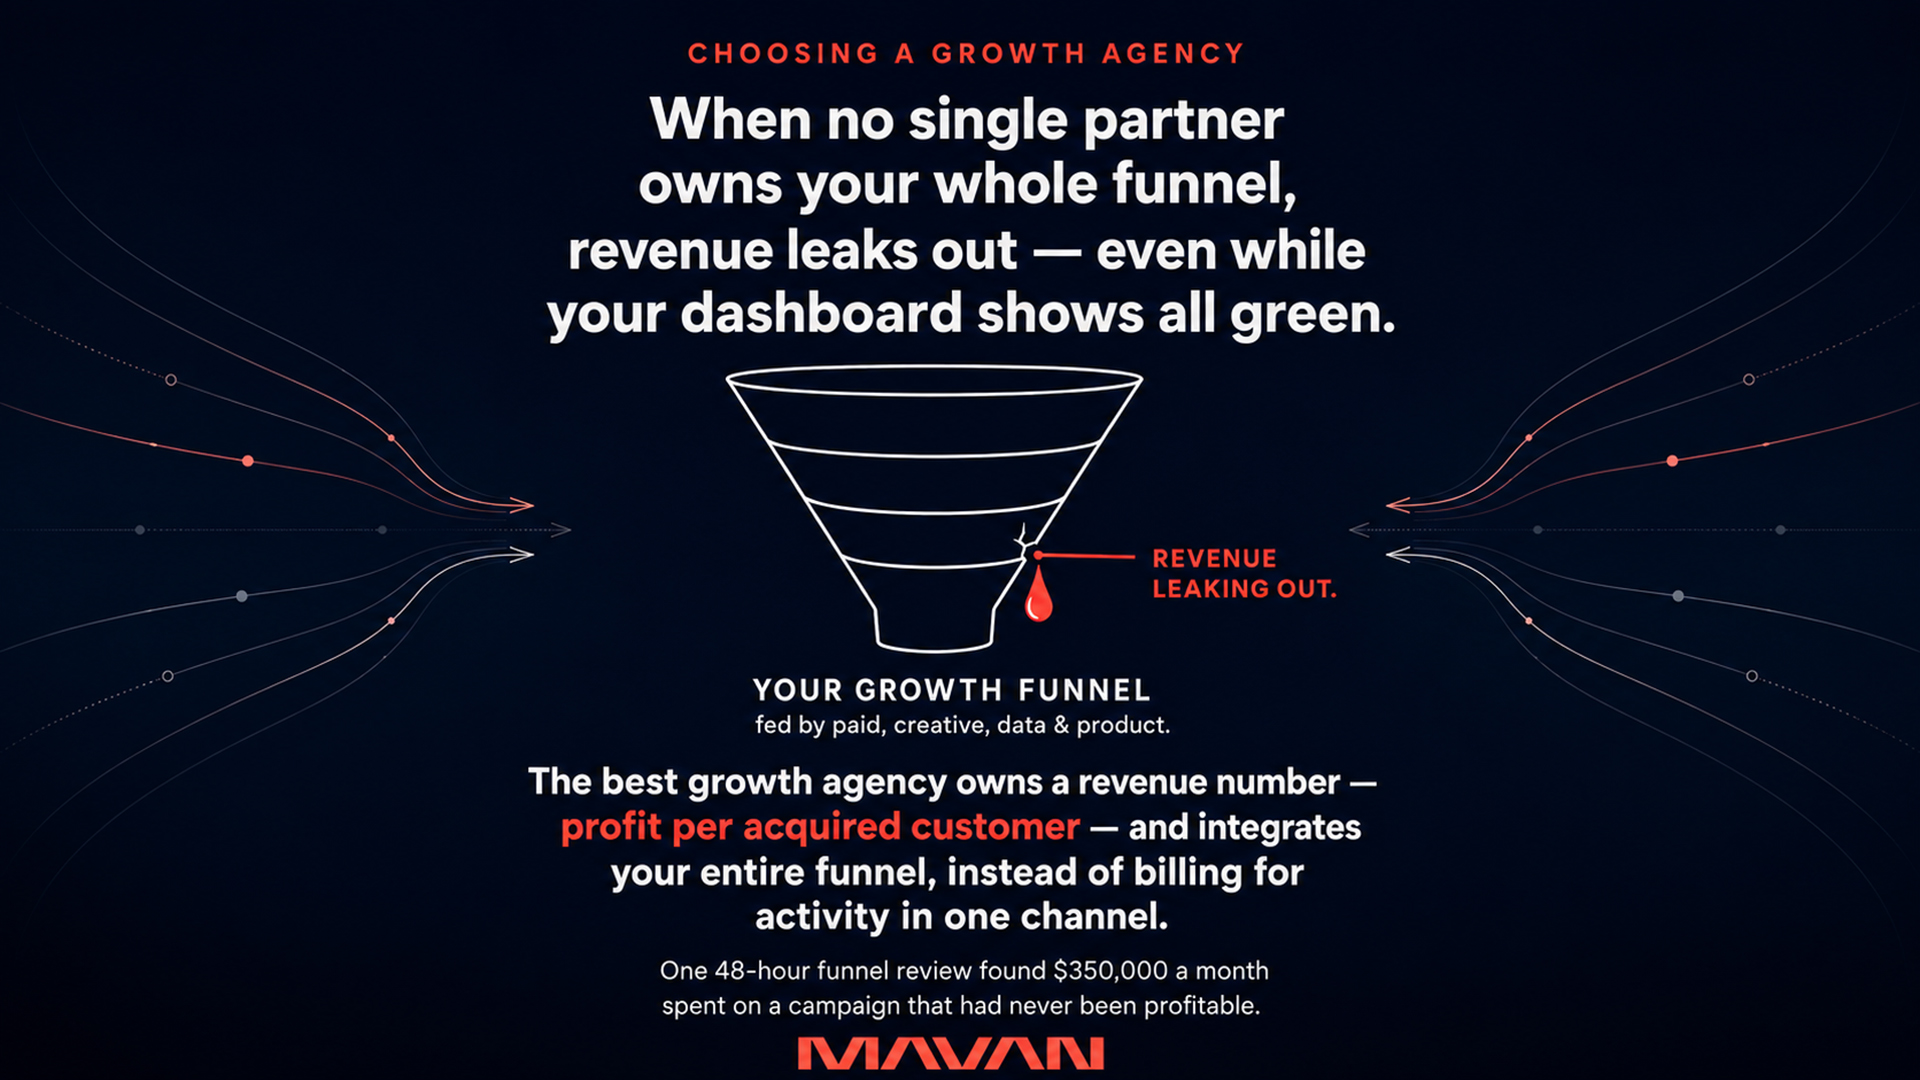
The best growth agency for a venture-backed or PE-owned company behaves less like a traditional agency and more like an embedded operating partner. It diagnoses your whole funnel, owns a revenue number such as CAC payback or LTV:CAC, and executes inside your team — rather than billing for activity in one channel.
-
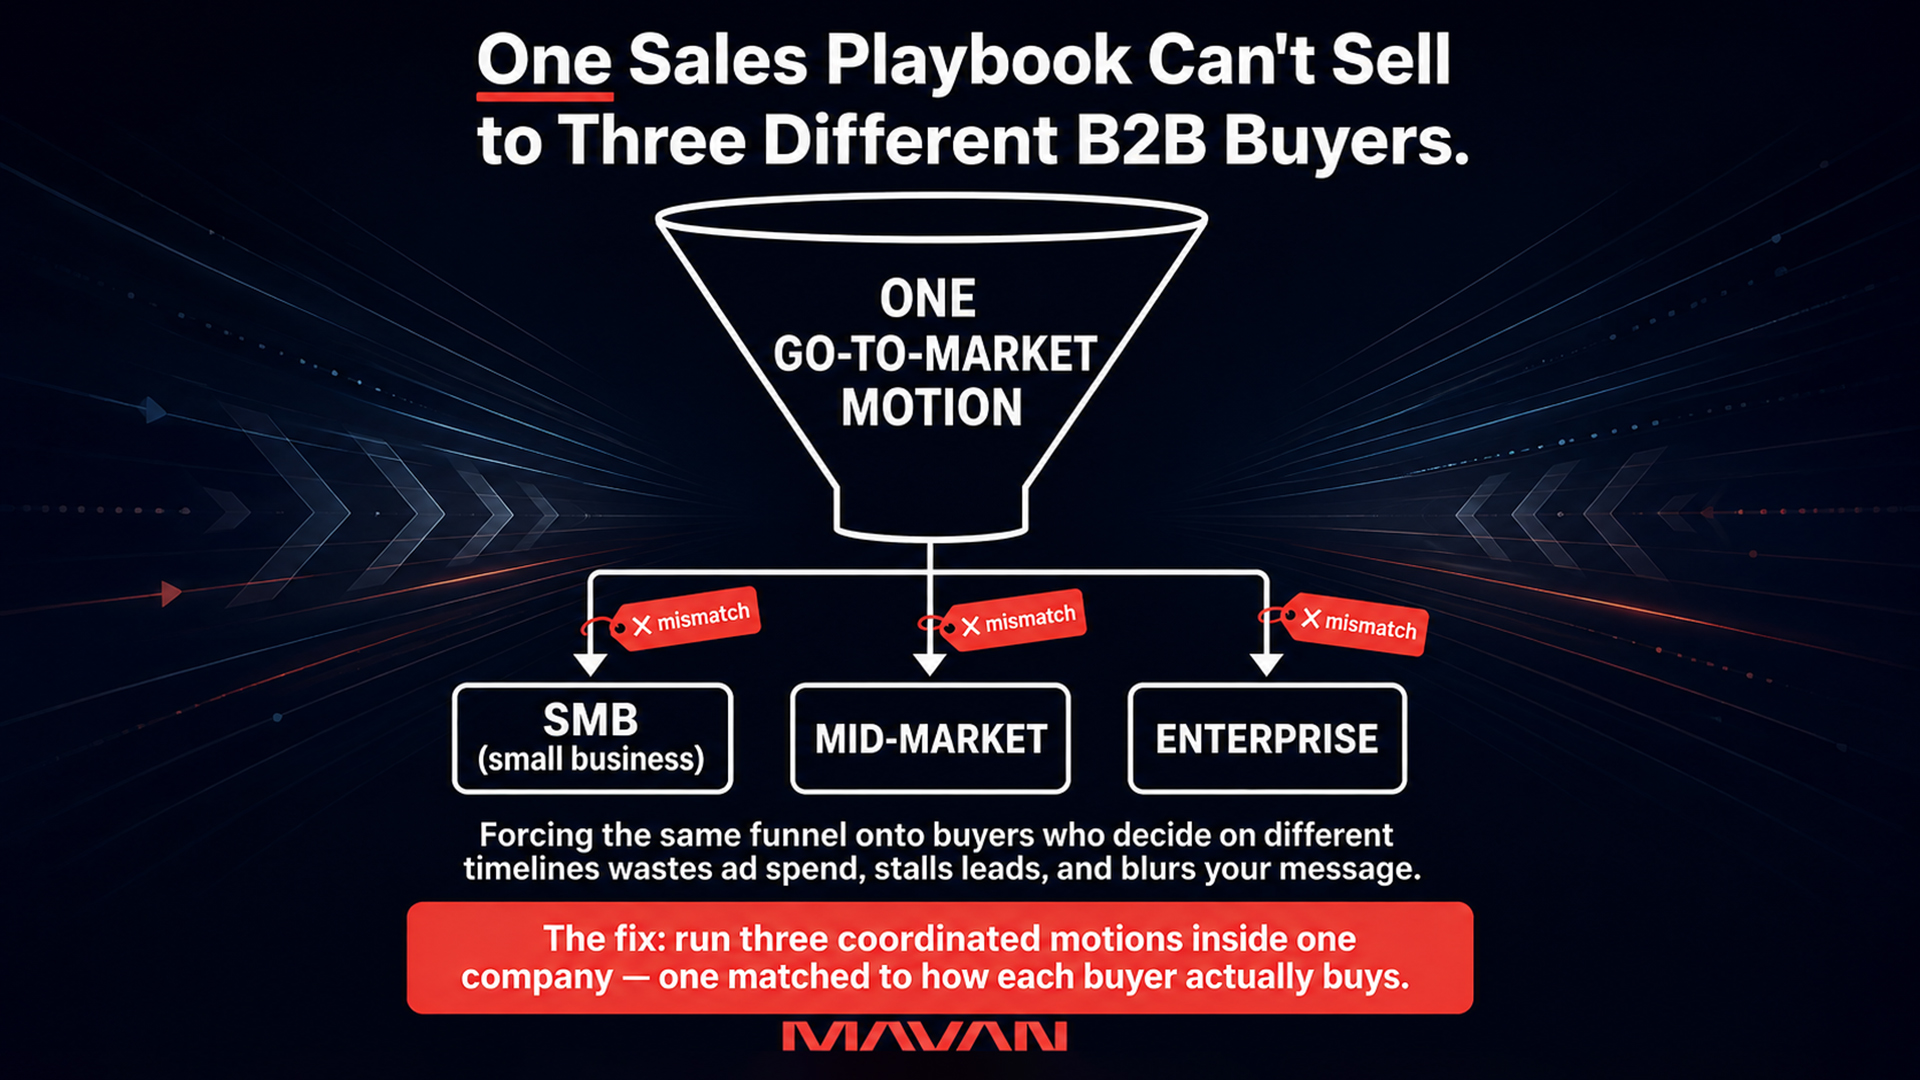
Is 1 GTM Motion the Biggest B2B SaaS Mistake?
The biggest go-to-market mistake in B2B SaaS is forcing one motion across SMB, mid-market, and enterprise, which buy on completely different timelines. The fix is running three coordinated motions inside one company: product-led growth for SMB, sales-assist for mid-market, and account-based marketing for enterprise, each matched to how that segment actually buys.
-

How Do You Evaluate a Portfolio Growth Partner?
To evaluate a growth partner for a fund’s portfolio, test two things. First, multi-company bandwidth: whether their operating model, not their headcount, lets them run many portfolio companies at once without quality slipping. Second, a proven playbook: a documented growth system that transfers between companies and survives leadership change, rather than living in one operator’s head.