
The best growth strategy for a venture-backed startup is to integrate before you spend. Fragmented teams, tools, and data inflate CAC even when every channel looks healthy. Fix the operating model first, then scale.
TLDR — Top 10 Growth Strategy Takeaways For Startups
- Integrate before you spend — fragmentation inflates CAC more than channels do
- Run one cross-functional pod, not five disconnected vendor relationships
- Build one source of truth — finance and product use the same number
- Pick a 90-day window and three constraints; align every meeting to them
- Use fully-loaded CAC for decisions, never the flattering version
- Pick a payback window you can survive a 20% miss on
- Swap DAU/MAU and gross ROAS for cohort retention and Day-90 margin
- Pre-commit kill, iterate, or scale criteria before any test launches
- Refresh creative on a calendar — fatigue is measurable, not a feeling
- Talk to MAVAN — get a 360 Blueprint diagnostic in your first two weeks
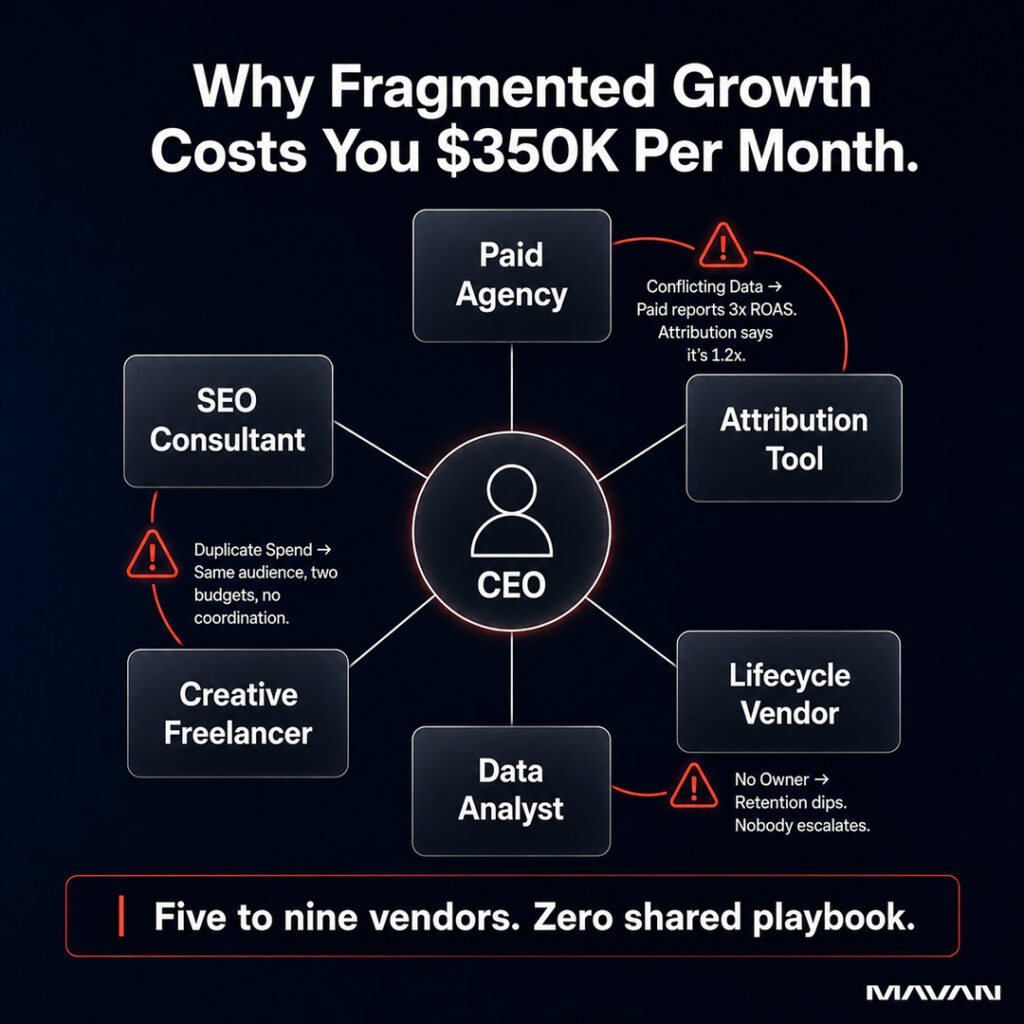
The $350K Per Month Nobody Owned
A consumer app client came to MAVAN convinced the answer to their growth slowdown was more Meta spend. Within forty-eight hours of running our 360 Blueprint diagnostic, we found something else: roughly $350,000 a month flowing into an evergreen paid media campaign. It had never been profitable. It hadn’t been updated in over six months. And it was still producing leads everyone assumed were working. “The teams were looking at different numbers,” recounts Matt Widdoes, Founder and CEO of MAVAN. “A dashboard showed the media teams everything was fine, when in reality the leads from that campaign had never been profitable.”
This structural problem is the single most expensive pattern we see at venture-backed startups today. Growth-stage companies rarely stall because the team isn’t working hard enough. They stall because hard work gets distributed across too many disconnected efforts, and nobody owns the system that ties them together. This article is for founders, Heads of Growth, and CMOs at Seed-through-Series C companies who are scaling spend, hiring fast, and wondering why every additional dollar feels heavier than the last.
The solution to this is simple: integrate before you spend, and the wins start compounding instead of canceling each other out.
What’s The Best Growth Strategy For A Startup In 2026?
The best growth strategy for a venture-backed startup in 2026 is to stop treating growth as a channel question and start treating it as an operating model. Before adding spend, integrate three things: a single source of truth for data, a cross-functional pod that owns the full funnel, and a 90-day cadence. Everything else is downstream.
The industry is tightening around us all, not loosening. Gartner’s 2024 CMO Spend Survey, reported by the Wall Street Journal, found marketing budgets dropped to 7.7% of company revenue in 2024 — down from 9.1% the year before. That is real money disappearing from the GTM line, and it’s happening at the same moment boards are asking for more aggressive payback windows. You cannot solve a margin-compression problem by adding more agencies. You solve it by tightening the loop between the people, data, and decisions that already exist inside your business.
Most startups we walk into have five to nine vendors and tools layered on top of each other: a paid agency, a freelance creative team, a CRO consultant, an SEO contractor, an attribution stack, a lifecycle vendor, a data analyst trying to stitch it all together. Each hire was rational. Together, they form an operating model where paid optimizes for platform metrics disconnected from the business, creative gets briefed in a vacuum, product ships features marketing learns about on launch day, and the CEO becomes the integration layer by default. The fix isn’t to fire anyone. The fix is to give the system a spine — owners, definitions, cadences — so the work compounds.
Why Is My CAC Rising Even When Nothing Changed?
Customer acquisition cost rarely rises because a single channel broke. It rises because attribution drifts, creative fatigue accumulates, product changes shift conversion patterns, and lifecycle stops feeding back into acquisition — all at once, all invisible until the blended number moves. The cause is almost always fragmentation, not a channel problem.
We have seen this pattern at every scale. “When I first joined King — Candy Crush — they had been running their own attribution for years,” Matt Widdoes shares. “New, and curious how it worked, I naturally started asking questions and quickly realized that a lot of the security measures around click fraud, stuffing, etc. were nowhere to be found. It had been built at a time when Candy Crush was seeing 100k downloads a week, and over the previous 5 years it had been something that nobody had ever really thought to go back to update.” The fix took roughly sixteen weeks of cross-functional work. The recovered ad spend was over $25 million per year. It’s not that King had a bad team, it was actually world-class. But even world-class teams accumulate hidden waste when no single function owns the integration layer.
A more recent example from Matt Widdoes underlines the same dynamic at the executive level. “I was recently introduced to the CMO of a major direct to consumer clothing brand, by one of their board members, spending $12M per month on paid. His biggest concern was ‘how do we scale Meta faster?’ I explained to him that we would want to first understand what’s happening in data — where it’s coming in and out from, how it’s being routed, which teams are looking at which dashboard, metrics — and from there we’d want to understand the perspective of the product teams, creative teams, and especially the lifecycle team to get a full understanding of the customer journey. He looked like he’d seen a ghost. ‘I can’t have you speaking with the data or product teams, they’re too busy, we just need to fix Meta ad spend.’ And there it was. The CMO of a major company did not have the internal will power or political capital to even get the other major business leaders in the org on a call.”
If your CAC is climbing and your gut tells you to push harder on the channel that broke, pause for a week.
Five questions, asked across functions, usually surface the real cause of rising CAC:
- Has our payer-cohort retention shifted in the last 60 days?
- Has our predictive LTV model been refreshed in the last 90?
- Is our paid team optimizing toward the same conversion event finance is reporting on?
- Has creative been refreshed across formats, or are we running variations of the same hooks?
- When was the last time product, lifecycle, and acquisition were in the same room?
If the answer to any of these is “I’m not sure,” that’s where the leak is.
How Do I Build A Growth Operating Model That Actually Compounds?
A growth operating model compounds when three pieces lock together: one accountable cross-functional pod, one source of truth for data, and one cadence that turns weekly experiments into quarterly outcomes. Without all three, wins leak back out the next quarter. With all three, your sixth month beats your second — without proportional spend.
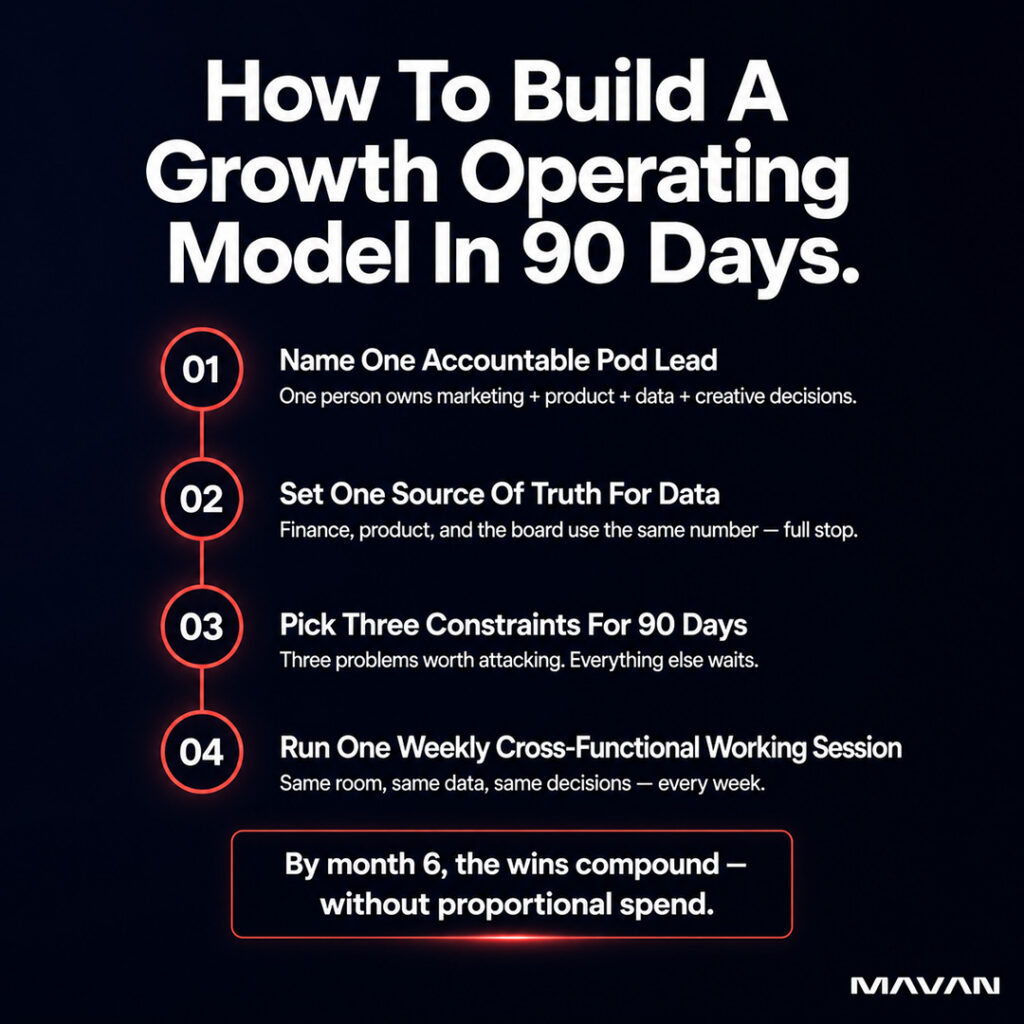
The pod is the load-bearing element. Growth work that matters — moving CAC, lifting activation, fixing payback — almost always requires marketing, product, engineering, and analytics operating as a unit. A single growth hacker cannot do this, no matter how senior. “The one thing I’ve seen over and over again are companies that have hired amazing people and set them loose to figure things out,” Matt Widdoes notes. “This is great in the beginning, but as you scale, systems have to be built to facilitate the communication around cross-functional insights. Teams at scale can get so focused on what’s on their own plate that they lose track of the rest of the org — or worse, they often feel like their growth limitations are directly tied to another org within the company not pulling their own weight.” The practical fix is to designate one accountable pod lead, write a simple RACI for the five or six decisions that recur every week (channel spend changes, creative greenlights, experiment approvals, lifecycle launches, data-definition disputes, board narrative), and make those decisions in the same forum.
The source of truth is the second piece, and it is non-negotiable. Dan Barnes, President of MAVAN, puts it bluntly: “You have to have a single source of truth, full stop. All things stem from that — no exceptions, no alternatives. Finance uses the same number that product uses. If they’re not, you have a process problem, not a data problem.” When numbers disagree in a meeting, the answer is always “the warehouse number is truth, we’ll investigate the discrepancy offline.” That single sentence has saved more board meetings than any dashboard tool we have seen.
The cadence is the third piece. Pick a 90-day window, pick three or four constraints worth attacking, and align every weekly conversation around progress against those constraints. Most teams already meet too much; the issue isn’t meeting frequency, it’s that the meetings aren’t pointed at the same target. Teams that replace standups with a Monday alignment block, an async daily report, and one weekly cross-functional working session ship more in a quarter — and spend half the time doing it.
Which Growth Metrics Actually Drive Board-Grade Decisions?
Boards make their best decisions when they see ten to twelve metrics split into leading and lagging indicators, each with one owner, one definition, and a threshold — not a target — that triggers action. The set should be small enough any executive can recite it. If your scoreboard has thirty rows, the board is reading; it isn’t deciding.
Dan Barnes frames the split this way: “Leading indicators give you early-stage signal that things are working. They’re mostly top-of-funnel metrics and that first conversion to payer. CPI, install-to-registration rate, day 1 retention, and first purchase conversion. These tell you quickly whether you have a problem before it shows up in the numbers that matter. Lagging indicators are the things that confirm whether the business is actually healthy over time: payer retention, long-term retention, repeat conversion rate, the ratio of organic to your overall DAU base, ROAS over time, and — critically — the discrepancy between forecast ROAS and actual ROAS. That gap between what you modeled and what you got is one of the most honest signals you have about whether your acquisition economics are working or degrading.” Most board decks bury that gap. Putting it on the front page changes the conversation from “are we hitting numbers” to “is our model of the business still accurate.”
A few specific metrics deserve replacing, in Dan’s view. DAU-over-MAU ratios feel like engagement signal but say nothing about monetization quality — swap them for retention by cohort vintage, tracked forward. Gross ROAS feels like performance but is a reporting artifact — swap it for contribution margin per acquired user at day 90. Month-over-month revenue growth feels like progress but in seasonal or lumpy-spend businesses it’s mostly noise — swap it for cohort revenue trajectory. The pattern: replace flattering metrics with metrics that are harder to game and tied to actual cash. On blended versus marginal CAC, Dan’s rule is “marginal for decision-making, blended for reporting. They answer different questions. Marginal tells you whether the next dollar is worth spending. Blended tells you how the overall machine is performing.”
| Replace This | With This | Why It’s A Better Signal |
|---|---|---|
| DAU/MAU ratio | Retention by cohort vintage, tracked forward | Tells you whether the product is actually improving — not whether spend is papering over churn |
| Gross ROAS | Contribution margin per acquired user at Day 90 | Accounts for returns, platform fees, and incremental lift — harder to calculate, impossible to game |
| Month-over-month revenue growth | Cohort revenue trajectory (Day 30, 60, 90 by acquisition month) | Strips out seasonality and lumpy UA spend to reveal the real growth signal |
The scoreboard itself can be a single page. Rows are the ten to twelve metrics; columns are definition, source of truth, owner, cadence, red threshold, yellow threshold, current value, prior period, trend. “It doesn’t need to be beautiful,” Dan says. “It needs to be the same table every single time so the board stops reading it and starts reacting to it.” That one habit — same table, same definitions, same owners, every meeting — is what turns a board from an audience into a co-pilot.
How Do I Scale Paid Acquisition Without Breaking Unit Economics?
You scale paid without breaking unit economics by anchoring every spend decision to fully-loaded CAC and a payback window you can defend to your board. From there, you expand into new geos, channels, and creative formats only inside that envelope. Channels do not break unit economics. Lack of measurement discipline does.
Sam McLellan, VP of Growth at MAVAN, is firm on which CAC to use. “Fully loaded. As full loaded as you can get it. It makes things more painful, but at some point you have to have those hard decisions. That’s growth in general. There are some times where you just have to go and say, we can spend the money — we’re just, it’s not going to come back. And we, so I don’t want to do that. We are a startup. We can’t really throw the money away. We have the sort of balance between runway and money in the coffer.” On LTV, Sam recommends starting gross and stripping out the obvious leakage first — Apple and Google platform fees, which can run 30%. Then compare to fully-loaded CAC. “LTV is probably one of the biggest things companies initially tackle. Everyone has a goal in mind. They’d obviously love to look at payback windows that are as short as possible so they can get the money back into their coffers ASAP. But the reality is this is a very competitive market.” Translation for the board: pick a payback window you can survive a 20% miss on, not a payback window that requires perfect attribution to look good.
Three real examples show what disciplined scaling looks like inside that envelope:
- ElevenLabs, the AI audio company, partnered with MAVAN to scale paid search from below $100K monthly to above $400K monthly while maintaining ROAS inside their payback target. That is over 1,000% ad spend growth, with up to 592% network ROAS in Tier 3 markets.
- Fireflies, a voice-meeting assistant, ran a similar geographic-expansion play and posted 46% CAC reduction quarter-over-quarter at $700K+ monthly spend, with broad-match testing delivering 20% lower CAC than exact and phrase campaigns.
- Titan rebuilt their tracking infrastructure first and then scaled — reducing CAC by over 3x while scaling paid acquisition volume 5x. In each case the unlock wasn’t a clever new channel. It was the measurement and attribution work that came before the spend lift.
“Within months, MAVAN scaled our Search spend to a high six-figure monthly budget, maintaining efficiency consistently for nearly a year. After we had proven the channel with MAVAN, we were able to confidently transition the program to our in-house team,” recounts Luke Harries, Head of Growth at ElevenLabs.
A specific operational pattern worth stealing: when MAVAN audited a B2B SaaS client’s Google account, search partners were consuming 78% of spend while generating zero opportunities. Pausing that single line freed budget for testing new creative formats and audiences inside the same payback envelope.
Most paid accounts have a leak like this hiding in plain sight — search partners, broad geo bleed, branded budget overlapping with SEO, retargeting overlapping with prospecting, automation layers misinterpreting conversion events. Finding them takes a week. Acting on them takes a quarter. Compounding them across a year is how disciplined teams outperform.
How Do I Know If My Growth Experiments Are Actually Working?
Growth experiments are working when each one produces a clear, documented decision — kill, iterate, or scale — within a fixed time window, and when wins compound across cohorts instead of staying isolated to the test that found them. The reason most experimentation programs underperform isn’t the tests themselves; it’s the absence of a decision discipline around them.
“Real growth demands cooperation, high transparency, low ego, and a culture of wanting to win,” Matt Widdoes explains. “As companies grow, a few key hires can destroy the ethos of ‘caring more about the baby’ than people do about taking credit or building the largest team they can under them to pad their resume.”
A working experimentation system has three protections against this cultural drift: a written hypothesis before the test runs, a pre-committed kill or scale criterion, and a shared retro that documents what was learned regardless of outcome.
KidStrong’s program is a clean example of this discipline applied. By systematically testing authentic, parent-filmed reels against polished agency creative and then optimizing the signup flow that received the winning ads, the team posted a 32% increase in form conversion and 37% improvement in paid CPL. “It truly felt like MAVAN was a part of our in-house team,” recalls Erin Clift, CMO of KidStrong. “MAVAN quickly drove results that cut our customer acquisition costs by 60%.” The win wasn’t the creative itself — it was the system that kept producing winning creative after the first one was found.
For teams setting this up for the first time, four practices accelerate the path to compounding wins.
- Pre-commit the decision. Before launching any test, write down what result triggers a kill, an iterate, or a scale. If you can’t define the threshold up front, the test isn’t ready to run.
- Test against business outcomes, not platform metrics. A 20% drop in CPM with no payback improvement isn’t a win — it’s noise dressed as one. Anchor every test to fully-loaded CAC, payback window, or a downstream conversion event finance recognizes.
- Run weekly retros, document everything. A test that produces a clear “no” with a documented hypothesis is worth more than three tests that produce ambiguous “maybes.” Compound learnings live in writing.
- Refresh creative on a calendar, not a feeling. Creative fatigue is real and it’s measurable. Schedule a refresh cadence and a portfolio of formats — static, video, UGC, conversation ads — before performance starts to slip, not after.
Frequently Asked Questions About Growth Strategy For Startups
What is the best growth strategy for an early-stage startup with limited budget?
For pre-seed to Series A teams, the best growth strategy is concentrated experimentation in one or two channels with disciplined measurement, rather than diversified spend. Build a single source of truth for acquisition data, run hypothesis-led tests with pre-committed decision criteria, and only add a channel when the one you’re in has a defensible payback window.
How long should a startup’s CAC payback period be?
Most venture-backed B2B SaaS teams target 12 to 18 months blended payback, while consumer subscription and gaming businesses often target 6 to 12 months depending on retention curves. The honest answer is whatever payback window you can survive a 20% miss on — not the window that requires perfect attribution to look acceptable.
Should I hire a fractional Head of Growth or work with an embedded growth team?
A fractional Head of Growth works when the constraint is strategy and the team can execute. An embedded growth team works when the constraint is bandwidth across multiple functions — marketing, product, analytics, engineering — and you need execution alongside strategy. Most Seed-through-Series C companies need the second.
How do I know if my growth slowdown is a channel problem or a structural problem?
Audit five questions across functions: Has cohort retention shifted in the last 60 days? Is the predictive LTV model current? Are paid and finance optimizing to the same event? When was the last creative refresh across formats? When did product, lifecycle, and acquisition last meet? If two or more answers are “I’m not sure,” it’s structural.
What metrics should I show my board about growth?
Ten to twelve metrics split into leading indicators (CPI, install-to-activation, day 1 retention, first purchase conversion) and lagging indicators (cohort retention, payer retention, contribution margin at day 90, forecast-versus-actual ROAS gap). Each metric needs one owner, one definition, and a red-yellow-green threshold that triggers action.
How do I scale paid acquisition into new geographies without losing efficiency?
Replicate the campaign structure that works in your home market, segment by tier-1, tier-2, and tier-3 economics, and bid against payback targets rather than CPI or CPA. ElevenLabs scaled from below $100K monthly to above $400K monthly across more than twenty international markets using this pattern, hitting up to 592% network ROAS in Tier 3 regions.
So, What’s Actually The Best Growth Strategy For A Startup Right Now?
The best growth strategy for a venture-backed startup in 2026 is to integrate before you spend. Fragmented teams, tools, and data silently inflate CAC even when every individual channel looks healthy. Fix the operating model — one accountable pod, one source of truth, one 90-day cadence — and the wins start compounding instead of canceling each other out. Channels do not break unit economics. Lack of measurement discipline does.
If you read this and recognized your own org in the $350K-nobody-owned story, the next step is small. We run a 360 Blueprint diagnostic in the first two weeks of every engagement — a cross-functional audit of acquisition, conversion, lifecycle, data, product, and creative that surfaces the integration leaks most teams have normalized. Most clients see at least one finding worth more than the cost of the engagement within days. Tell us what’s keeping you up at night and we’ll come back with high-level observations, recommendations, and a proposal for what compounding growth looks like for your business within ninety days.
Tell us what growth problems you need help solving. Contact us today.
Casey Rock is Content Director at MAVAN, where he helps turn complex ideas into clear, strategic content that drives growth. With over 15 years of experience across content strategy, SEO, media, and digital marketing, Casey focuses on building content systems that connect audience insight, brand storytelling, and measurable business outcomes.
Book a complimentary consultation with one of our experts
to learn how MAVAN can help your business grow.
Want more growth insights?
Thank you! form is submitted
[hubspot type=”form” portal=”20951211″ id=”9c538ed2-fb12-45f1-a573-ad7953c058cc”]
Related Content
-
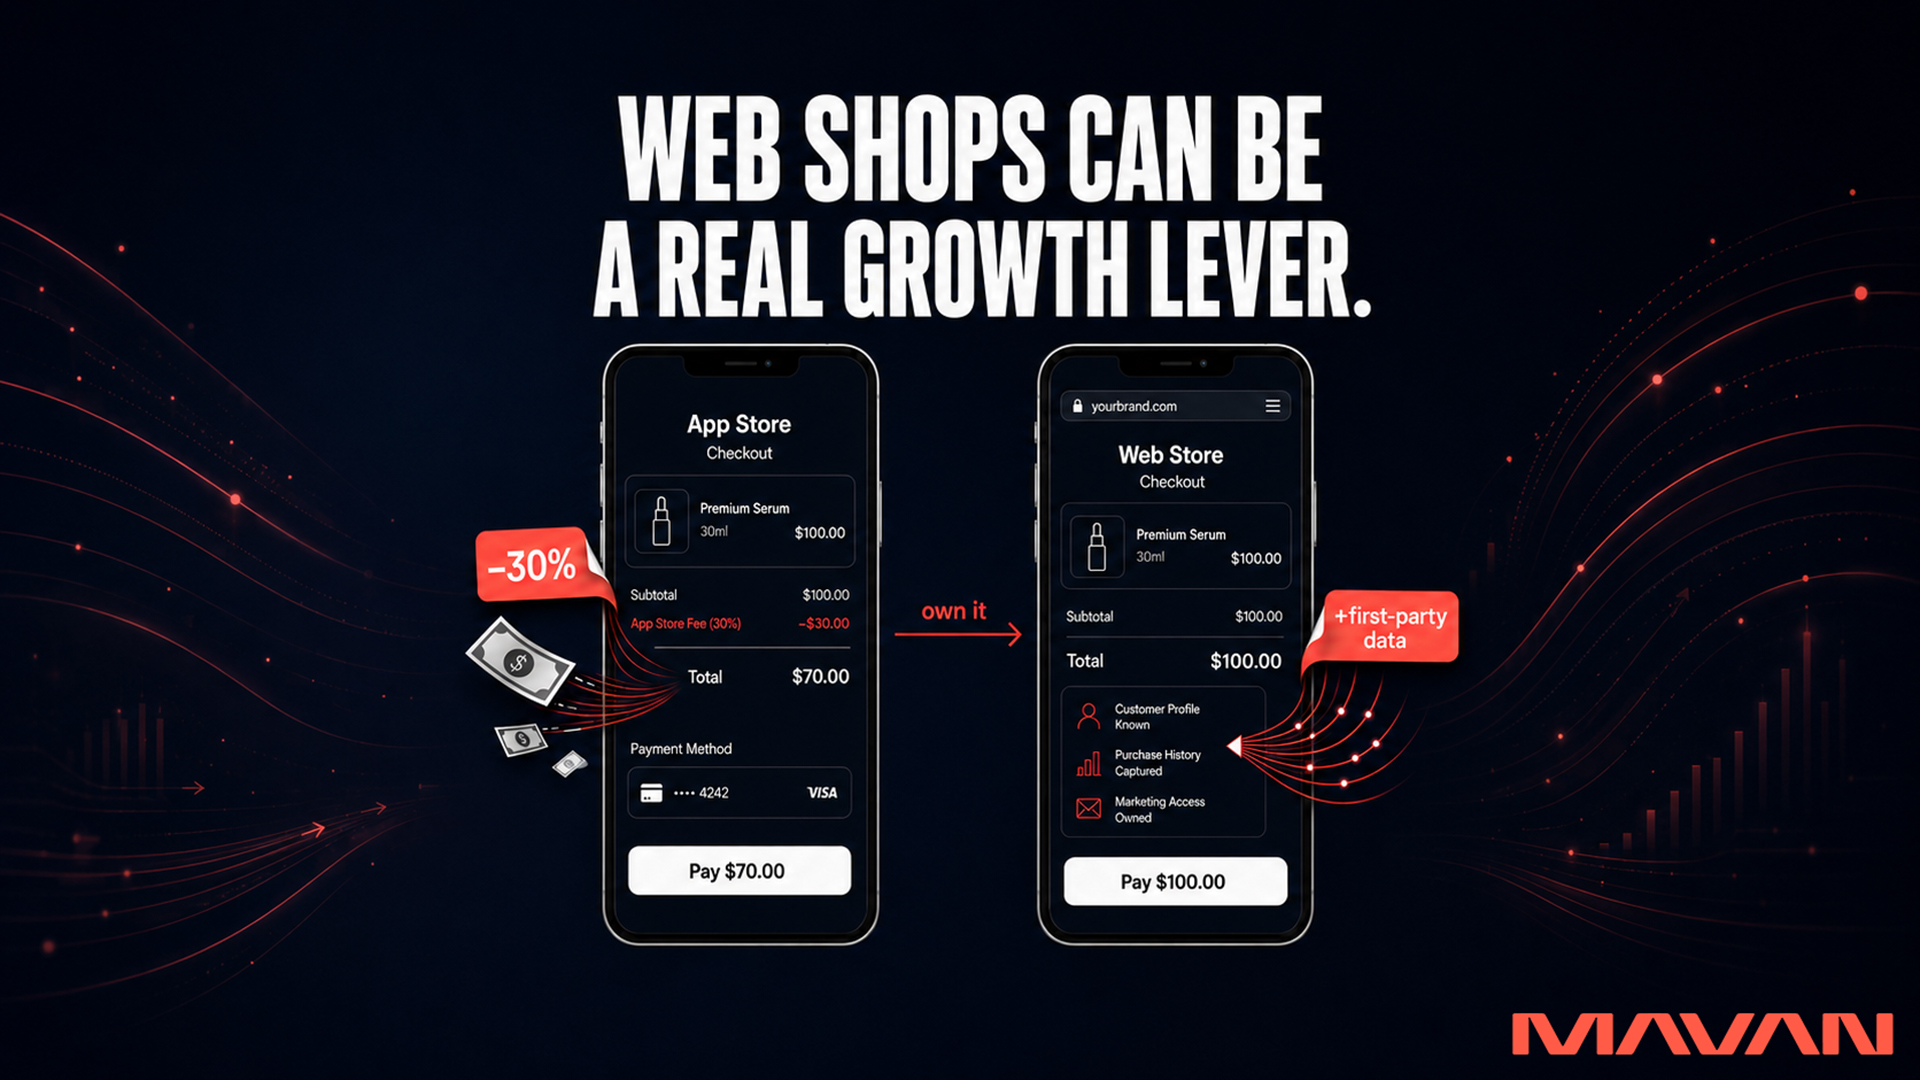
Are Mobile Game Web Shops A Growth Lever In 2026?
After Apple’s IDFA changes, mobile game studios grow by launching a web shop — a game-branded web store they own. It reclaims the 15 to 30 percent that app stores take on every purchase and rebuilds the first-party player data that makes user acquisition work again.
-

How Do You Avoid Hiring A Bad First Growth Hire?
Most first growth hires fail because the person is dropped into a company with no working system to sharpen, not because they lack talent. The fix is to build the system first — document what already drives growth, or embed a growth pod to turn scrappy channels into a coordinated system with a 90-day playbook — then make your senior hire, so they inherit a working machine instead of a blank page.
-

How Do You Use AI For Winning Ads In Creative Development?
AI’s biggest near-term payoff in growth is creative. Use it to generate more concepts and rebuild what already works — then rely on human taste, audience truth, and disciplined testing to decide which creative ships and scales.