
A payback window is a business decision, not a fixed law. The teams that scale fastest will accept a lower return on ad spend at higher volume — because total profit, not a clean ROAS number, is what compounds.
TLDR — How to Set a Payback Window That Maximizes Total Profit
- Your payback window is a business decision, not a fixed rule — set it on purpose around your margins, retention, and stage.
- Stop optimizing for ROAS. It’s a daily diagnostic, not a goal — total profit at scale is the real target.
- A high ROAS on a small budget is usually a warning that you’re underspending and leaving profit unclaimed.
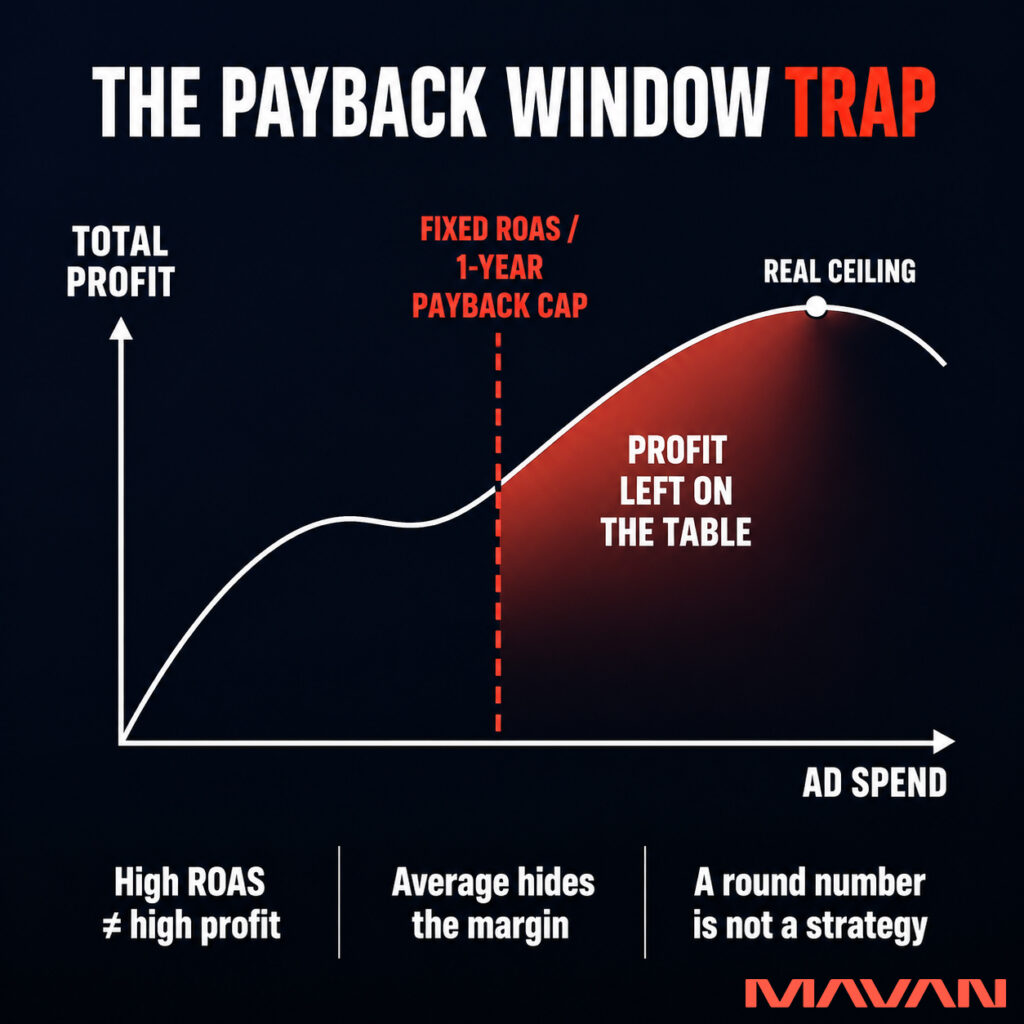
- Decisions live at the margin. A 4x average return can hide a 0.6x return on your next dollar.
- Push spend on one channel until the marginal return hits your floor — that breaking point is your real ceiling.
- Replace gross ROAS with contribution margin per customer at Day 90 — it’s harder to game and closer to truth.
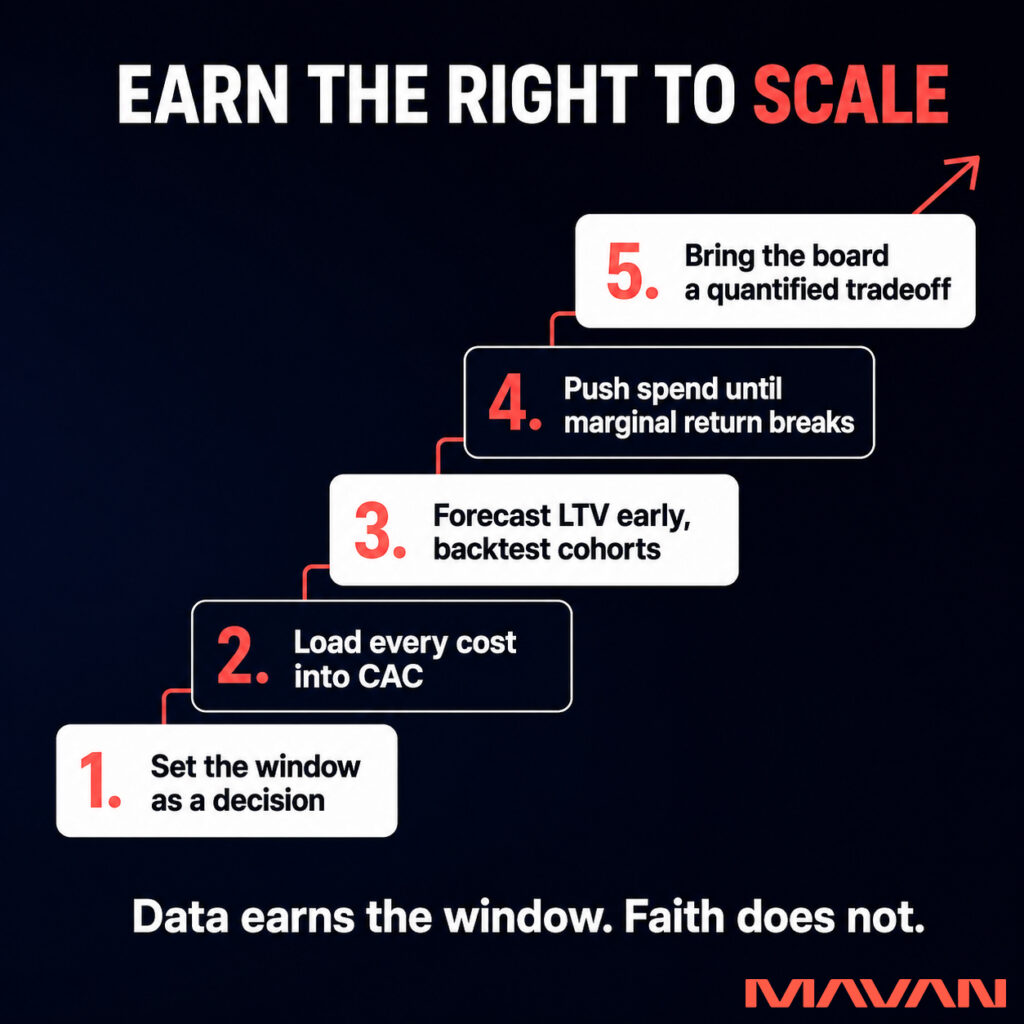
- Earn a longer window with proof: loaded CAC, backtested LTV cohorts, and incrementality tests — not faith.
- Don’t extend the window if cash is tight, lifetime is short, or one channel carries your growth — hedge first.
- Want to find your real ceiling? Reach out to MAVAN — we’ll map where profit is hiding in your growth engine.
A studio acquired a mid-sized mobile game earning roughly $35 to $40 million a year. Within a couple of years, the same game was earning $80 to $100 million a year. The product barely changed. The marketing did. That gap — tens of millions in profit, sitting on the table the whole time — is the story most growth leaders are living through right now and can’t quite name.
We hear the same tension in nearly every board meeting we sit in on. Leadership wants a clean payback window and a tidy return on ad spend. The growth team can feel that the real number is bigger, but they don’t have the language or the data to make the case. So the spend stays capped, the model stays conservative, and the profit stays theoretical.
This article is for the person who owns that number — the VP or Head of Growth, the CMO, the founder running acquisition under a board’s eye. You are not behind. You are sitting on a working machine and an artificial speed limit. The job is to find the real speed limit, prove it, and earn the room to push.
Here is the one idea to carry out of this piece: your payback window is a business decision, not a law of physics — and the teams that win scale spend toward maximum total profit across the full customer lifetime, not toward a round-number ROAS or a one-year payback.
Why Do Boards Fixate on a Short Payback Window?
Boards fixate on short payback windows because they feel simple and safe. A payback window — the time it takes to earn back what you spent to acquire a customer — turns a messy future into one comforting number. The catch: that number is often arbitrary, and defending it too rigidly caps the growth the board wants.
The pull toward a tidy number is understandable. It maps to how finance teams think and how investors judge. Brian Sapp has run user acquisition and growth at WB Games, Jam City, and Rec Room. On MAVAN’s Growth at Scale podcast, hosted by Founder and CEO Matt Widdoes, he named the trap directly. Plenty of boards and investors, Sapp said, “get kind of fixated on this like either one-year payback or 200% ROAS,” and in doing so “they’re kind of missing the forest for the trees.”
The benchmarks themselves refuse to agree on a single right answer. SaaS investor David Skok’s long-standing rule of thumb is to recover acquisition cost in under twelve months. Bessemer Venture Partners, in its State of the Cloud guidance, calls twelve to eighteen months good, six to twelve months better, and zero to six months best. Yet benchmark data from OpenView and High Alpha shows payback periods stretching as companies scale, because early budget captures the cheapest customers and later budget reaches harder ones. The honest read across all of it: a “good” payback window depends on your margins, your retention, your runway, and your stage — not on a number a board likes the sound of.
Sam McLellan, VP of Growth at MAVAN, frames the window as a deliberate company choice rather than a default. “Here’s the window that we’re comfortable as a company in order to make this a scalable product,” is how he describes the starting question. The window is a tool you set on purpose. When it hardens into dogma, it stops serving the business and starts shrinking it.
Is ROAS the Right Number to Optimize For?
ROAS — return on ad spend, the revenue you get back for every dollar spent — is a useful diagnostic, but it is the wrong thing to maximize. ROAS is a reporting artifact. Total profit at scale is the goal. A high ROAS on a small budget often means you are being too cautious and leaving real money unclaimed.
The clearest illustration comes from the game Brian Sapp helped scale. During his years leading user acquisition at Jam City, his team acquired a mid-sized match-three title and the studio behind it, then scaled it “to about 80 to 100 million a year with no change other than marketing,” he said. The lever was not a better ROAS. It was a willingness to accept a lower one in exchange for far more volume.
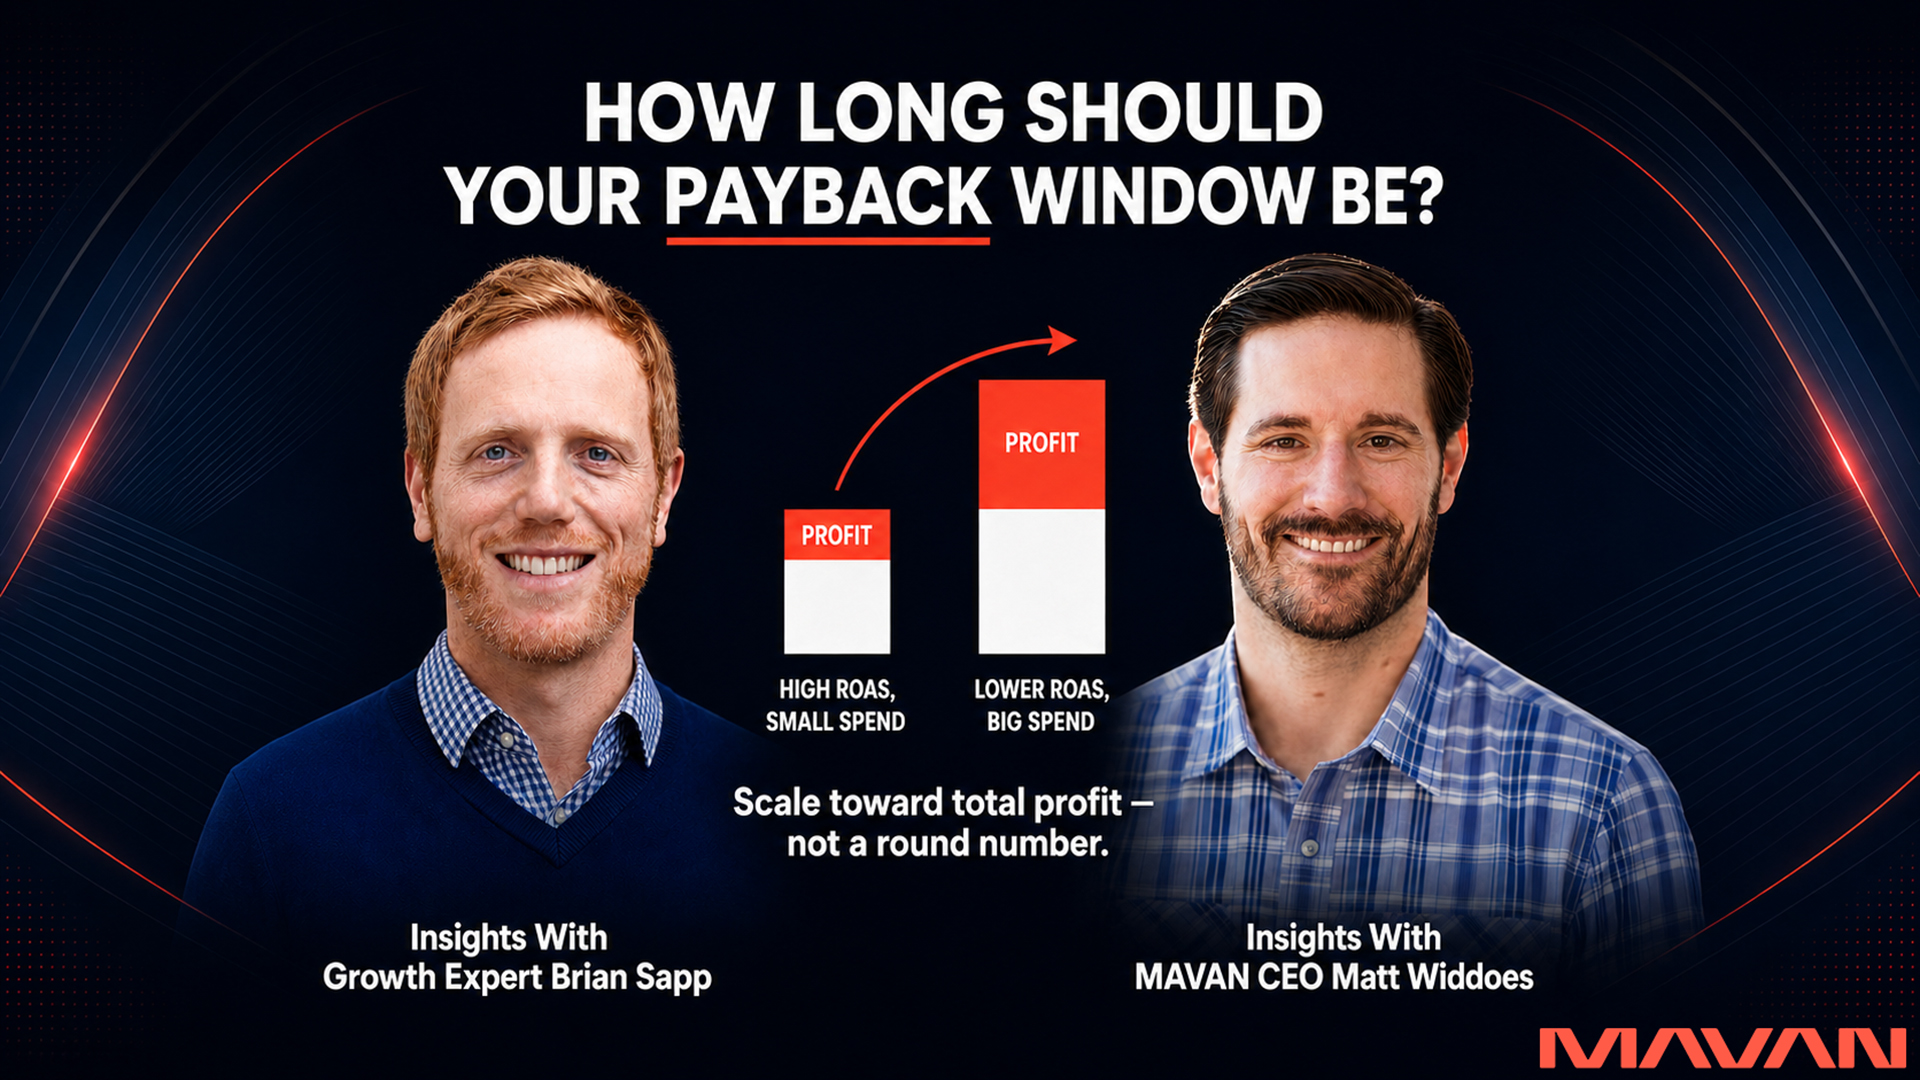
The math is worth walking slowly, because it is the heart of the matter. Picture spending $500,000 a month at a 200% return — two dollars back for every one in. You spend $500K, make $1 million, and clear about $500K in profit. Now triple the spend to $1.5 million a month, and watch the return slip to 150%. You generate $2.25 million in revenue, subtract the $1.5 million, and clear $750K in profit. The efficiency dropped. The profit grew by half. As Sapp put it, the move works when “you can scale enough where the total profit is more than it was at the small level of spend.”
A 5x return on a tiny budget is a vanity number. A 2x return that clears more total profit is a business.
This is not a gaming quirk. It is basic unit-economics math, and the broader market has caught up to it. Triple Whale notes that a campaign with low short-term ROAS can still be profitable when it brings in customers with high lifetime value. Dan Barnes, President of MAVAN, makes the same point in sharper terms when he describes what boards should stop watching. Gross ROAS, in his words, “feels like a performance metric but it’s a reporting artifact” — and he replaces it with contribution margin per acquired customer at Day 90, the actual profit a customer leaves after costs three months in. Contribution margin is harder to calculate and, as Barnes says, “impossible to game.”
So ROAS keeps its job as a daily gauge for media buyers. It loses its job as the company’s North Star. The number that belongs on the wall is total profit at the scale you have proven you can reach.
What’s the Difference Between Marginal ROAS and Average ROAS?
Average ROAS is the return across every dollar you have spent. Marginal ROAS is the return on the next dollar. The two can tell opposite stories. A channel showing a healthy 4x average return can hand you a 0.6x marginal return — sixty cents back on each new dollar. Decisions live at the margin, not the average.
This distinction is where most scaling mistakes hide. Analysis from SegmentStream shows how a dashboard can display a flattering average while the incremental spend behind it loses money on every dollar. The marketing platform smears the bad marginal dollars together with the good ones, and the blended figure looks fine. You scale into a channel that stopped paying you back weeks ago, and the average hides it.
Brian Sapp’s instinct as an operator is to push spend straight at the margin until it reveals the truth. “It’s good to push to the limit to understand where that efficiency really breaks down,” he said. The question he keeps asking is blunt: “how does the ROI perform at scale? And what are the diminishing returns as we scale?” Pushing those limits, he added, “tells you what the elasticity is of that ROI.” Matt Widdoes, Founder and CEO of MAVAN, frames the same move in plainer terms — once a campaign holds its targets at real spend, keep “shoveling money into that until it breaks.” That breaking point is your real ceiling. Everything below it is profit you have not claimed yet.
Finding the edge is a method, not a guess. Here is the loop we run with clients:
- Hold every other variable steady, then raise spend on one channel for a defined window. A clean test needs a clean change.
- Compare the new revenue against the new spend — not the total against the total. That ratio is your marginal return.
- Watch where the marginal return crosses your acceptable floor. That crossing point, not a platform’s dashboard, is where you stop scaling that channel.
- Reallocate the next dollar to the channel with the highest marginal return. Money should follow the next-dollar math, not last quarter’s average.
How Do You Earn the Right to Extend Your Payback Window?
You earn a longer payback window with data, not faith. Before you ask the board for more room, you need three things working together: predictive lifetime-value models that forecast a cohort’s worth early, backtested cohorts that prove past forecasts right, and incrementality tests that confirm paid spend caused the growth. Proof replaces faith.
The data has to arrive fast enough to act on. Matt Widdoes, Founder and CEO of MAVAN, describes the leading-indicator discipline that makes scale safe at large budgets. “We’ve always made day three, day seven type targets,” he said — early reads that predict where a cohort lands at month one and year one, so the media team can keep money moving without flying blind. Brian Sapp agrees on cadence, with a caution that noisier data now makes single-day reads unreliable: monthly, he said, “is the right beat cadence.”
Backtesting is the discipline that keeps the model honest. Widdoes describes the work plainly — go back to the assumptions behind a cohort’s acquisition cost nine or eighteen months ago, then check whether the customers performed the way the model promised. Two forces usually push the real answer past the conservative one. Customers who stay tend to keep staying; “if a user is going to stick around, they tend to stick around,” as Sapp put it, especially the payers who form a years-long relationship with a product. And the product itself rarely stands still — new features, new revenue streams, and lifecycle programs lift the lifetime value of cohorts you acquired before any of it shipped. A forecast built on the old product undersells the new one.
This is also where measurement rigor matters most. Sam McLellan, VP of Growth at MAVAN, is blunt about the foundation: he wants a fully loaded acquisition cost, “as full loaded as you can get it,” counting tools, people, and the real cost of running the business — not the flattering platform number. He also flags the prerequisite most startups skip. You cannot run any of this “unless you’ve got attribution in place,” along with the financial models to support it. The teams that earn a longer window are the teams that built the plumbing first.
A useful gut check from the trenches: experienced operators almost never wish they had spent less. “I’ve always looked back on the data and been like, we should have spent more,” Sapp said. “Basically always.” When the backtest keeps confirming that, the window is asking to be extended.
How Do You Make the Case to Your Board?
You make the case by presenting a quantified tradeoff, not a request for trust. Show the board two things side by side: the return on spend at the new scale, and what that scale does to the business month over month. Frame it as a choice they get to make, with the money math on each option.
The framing that lands is explicit about cost. Dan Barnes, President of MAVAN, has watched the best founders handle these moments with near-clinical control. The script he points to is structural: here’s what’s true, here’s what we’re doing, here’s what it costs, here’s what we need from you. The tradeoff language he quotes is exact — something close to, “Maintaining current CAC targets means we grow 20% slower this quarter. Relaxing them gets us to target but extends payback period by 45 days. We’ve chosen to hold the line for 60 days and reassess.” That, in his words, “is not uncertainty. That’s control.”
The two views need to live in one model. Barnes splits them cleanly. One model shows the return on spend as you scale — spend this, make this. The other shows what the spend does to revenue, daily active users, and monthly active users, month after month. You bring both to the board and say, in effect, here is what we expect, and here is the date we will know. A date, Barnes notes, “converts uncertainty into a decision point.”
When the case holds up, funding tends to follow — because a working acquisition engine is the easiest thing in business to finance. Matt Widdoes, Founder and CEO of MAVAN, captures it with a phrase: there’s almost always “money in the banana stand.” Reframe the ask in those terms. “If it’s a money problem, it’s a money opportunity,” he said, and there are plenty of people who want to put capital behind a proven, profitable opportunity. Your job is to do the work that makes the machine legible. The capital is the easy part.
There is real urgency here, and it is the productive kind. Every month the window stays artificially short is a month of total profit you chose not to collect. The customers you skip are not gone — they are bought by a competitor with a longer window and more conviction. The opportunity does not wait. The good news is that the path forward is concrete and starts with the data you can pull this week.
When Should You Not Extend Your Payback Window?
You should not extend your payback window when cashflow is tight, when your customer lifetime is short by nature, or when one channel carries too much of your growth. A longer window ties up capital for longer. If the business cannot carry that, conviction becomes recklessness. The discipline is knowing the difference.
The strongest objection is real, and we will not wave it away: extending the window costs cash now for profit later, and not every company can afford the gap. Public companies often cannot stomach the cost on a quarter’s profit-and-loss statement. Some products pay back on a schedule that forbids patience — much direct-to-consumer e-commerce and many subscription models live or die inside the first three to six months, where stretching the window makes no sense. Consumers are fickle, and a two-year bet can sour before it matures.
Two more risks deserve a hard look before you push. The first is channel concentration. Dan Barnes, President of MAVAN, calls it the fragility boards rarely see: “Most performance marketing is built on one or two channels performing,” and when a platform changes its policy or its auction shifts, “the entire growth model can reprice overnight.” A longer window on a fragile channel multiplies that exposure. The second is going all-in without a fallback. Sam McLellan, VP of Growth at MAVAN, describes what spooks a board most — betting everything on one motion with no plan B, so that if it fails, “their investment suddenly like in jeopardy.” Hedge first. Keep an alternative warm.
Here is what dismantles the objection rather than ignoring it: paid spend is reversible, and good data turns a long bet into a managed one. As Brian Sapp notes, “the thing about UA is that you can always pull back. It’s like it’s immediate.” You are not locking the money away. You are committing it conditionally, watching the marginal return, and keeping your hand near the dial. Extend the window only on the cohorts your backtest has earned, only on channels with audience headroom, and only with a fallback ready. Done that way, a longer window is not a gamble. It is a calculated, retractable investment in profit you have already proven exists.
What Boards Anchor On vs. What Drives Profit
Structured side by side, the swap is simple. Each comforting metric hides something, and each has a sturdier replacement that is harder to game.
| Board anchors on | What it hides | Measure instead |
|---|---|---|
| Fixed payback window | Stage, margin, and retention all move it | Cohort revenue trajectory at 30 / 60 / 90 days |
| Gross ROAS | Fees, returns, and incremental lift | Contribution margin per customer at Day 90 |
| Average ROAS | The return on the next dollar | Marginal ROAS at current spend |
| One-year payback rule | Multi-year value of loyal payers | Backtested LTV by cohort vintage |
Frequently Asked Questions About Payback Windows, ROAS, and Profit Growth
What is a good CAC payback period for a startup?
There is no single right number. Many SaaS investors target under twelve months, with Bessemer calling six to twelve months strong, but the right window depends on your gross margin, retention, runway, and stage. Set it as a deliberate company decision, then revisit it as cohort data matures.
Does a lower ROAS mean my campaigns are failing?
Not necessarily. A lower return on ad spend at much higher volume can produce more total profit than a high return on a small budget. Judge campaigns by the absolute profit they clear at scale, not by the ratio alone. A very high ROAS often signals you are spending too little.
How do I calculate marginal ROAS?
Compare incremental revenue to incremental spend over a defined window, rather than dividing total revenue by total spend. Raise spend on one channel, hold everything else steady, and measure the return on just the added dollars. When that figure drops below your acceptable floor, you have found the channel’s ceiling.
How long should I wait before scaling a winning campaign?
Watch the campaign hold its targets at real spend over a monthly cadence, not a single day, before you scale hard. Single-day reads are too noisy under current measurement conditions. Confirm the marginal return stays healthy as you raise budget, then keep scaling until it approaches your floor.
Can I always pull paid spend back if the bet doesn’t work?
Yes — paid acquisition is one of the few growth levers you can reverse immediately. That reversibility is exactly why a longer payback window is a managed risk rather than a gamble. Commit conditionally, watch the marginal return, and keep your hand near the dial.
What data do I need before extending my payback window?
Three things working together: fully loaded acquisition cost, predictive lifetime-value models with backtested cohorts, and incrementality testing to confirm paid spend caused the growth. Attribution and a sound financial model are the prerequisites. Without that foundation, a longer window is faith, not strategy.
Scale Toward Profit, Not a Round Number, In Your Payback Windows
Your payback window is a business decision you control, not a fixed rule handed down to you. The teams that pull ahead scale spend toward maximum total profit across the full customer lifetime, accepting a lower return on ad spend at higher volume when the math clears more profit overall. They earn that room with predictive lifetime-value models, backtested cohorts, and incrementality tests — then bring the board a quantified tradeoff instead of a request for faith. Done with discipline and a fallback ready, a longer window is a retractable investment in profit you have already proven exists.
If you do one thing this week, do this: pull your last twelve months of cohorts and compare what each one was truly worth at Day 90 against what you forecasted when you acquired it. If the real number beat the forecast — and for loyal-payer products it usually does — you have the first slide of your board case, and your window is asking to be extended.
Book a complimentary consultation with one of our experts
to learn how MAVAN can help your business grow.
Want more growth insights?
Thank you! form is submitted
[hubspot type=”form” portal=”20951211″ id=”9c538ed2-fb12-45f1-a573-ad7953c058cc”]
Related Content
-
ROAS vs Total Profit: How Long Should Your Payback Window Be?
Your payback window is a business decision you control, not a fixed rule handed down to you. The teams that pull ahead scale spend toward maximum total profit across the full customer lifetime, accepting a lower return on ad spend at higher volume when the math clears more profit overall. They earn that room with predictive lifetime-value models, backtested cohorts, and incrementality tests — then bring the board a quantified tradeoff instead of a request for faith. Done with discipline and a fallback ready, a longer window is a retractable investment in profit you have already proven exists.
-
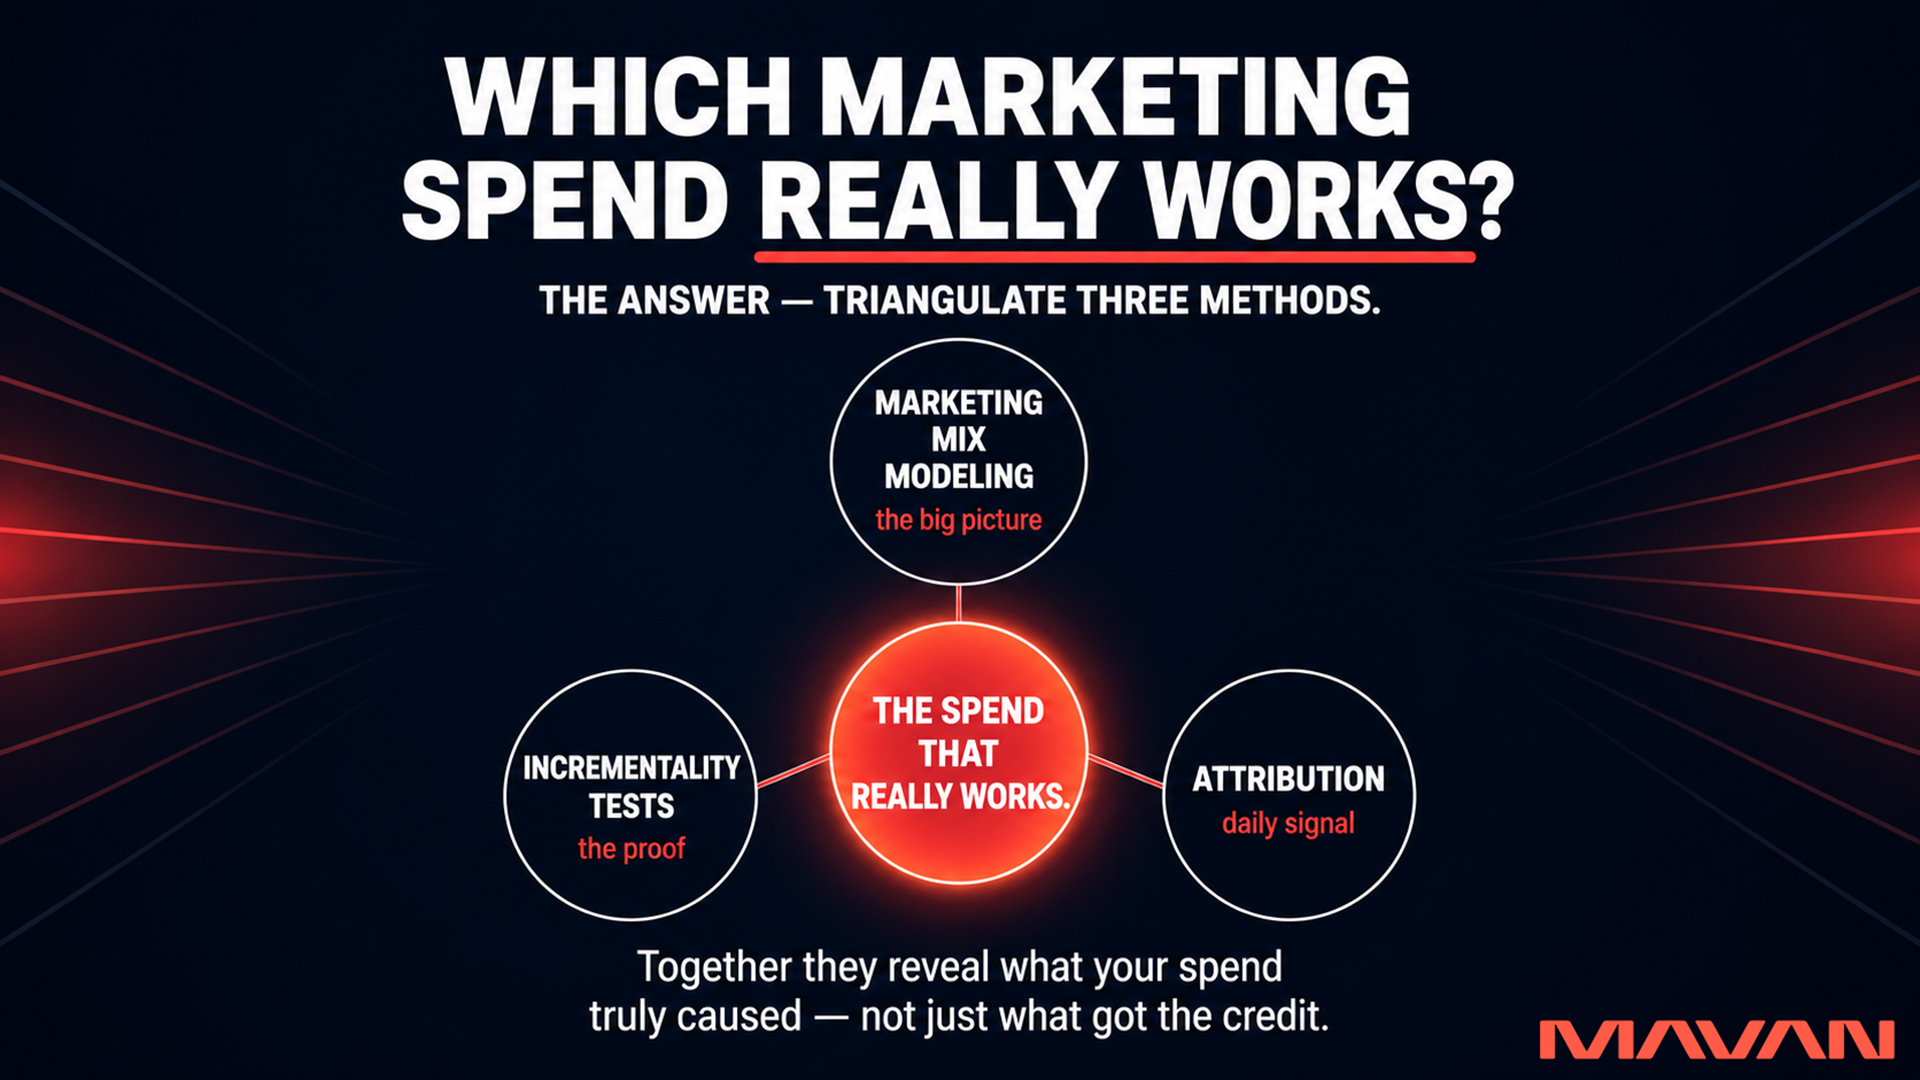
How Do I Measure Which Marketing Spend Really Works?
To know which marketing spend actually works, combine three methods — marketing mix modeling for the strategic portfolio view, incrementality tests for causal proof, and platform attribution for tactical signal — and run them through one source of truth your board can trust.
-
Why Is Creative The Biggest Acquisition Lever (And Does AI Fit)?
Creative has become the biggest lever in paid user acquisition because privacy changes erased most targeting signal, so platforms like Meta now read your ad itself to decide who sees it. The smartest use of AI is extending the life of proven creative — not generating new assets from scratch, which audiences and ad algorithms increasingly ignore.