
A board-ready KPI scoreboard uses 12 metrics with one shared definition, one owner, one data source, and red-yellow-green thresholds tied to specific actions. It replaces competing narratives with a single shared reality that makes board meetings about decisions, not arguments.
TLDR — What Do You Need to Build a Board-Ready KPI Scoreboard in 14 Days?
- Most board arguments about growth aren’t about data — they’re about competing versions of the truth.
- Every metric on your scoreboard needs four things: one definition, one owner, one source of truth, and a threshold.
- If “CAC” means five different things across five teams, it means nothing — write definitions down.
- Assign one owner per metric based on who can actually change the outcome.
- One data warehouse is truth — investigate discrepancies offline, never in the meeting.
- Use red/yellow/green thresholds as behavior triggers, not aspirational targets.
- Aim for 12 metrics: four weekly leading indicators and eight monthly lagging indicators.
- Apply the “one drill-down” rule — one level of segmentation max if a number is yellow or red.
- Week 1: lock governance (metrics, owners, thresholds). Week 2: lock rhythm (Monday review, pre-read sent three days early).
- If your board meetings keep circling the same arguments, MAVAN can embed and build this system with you.
You’ve been in this meeting before. The numbers look decent on the surface. Leadership sees green lights. You see cracks forming underneath. Both sides can find data to back their story — and that’s exactly the problem.
MAVAN President Dan Barnes recalls a board meeting where top-line ROI looked acceptable, but retention was weak. A small group of hyper-engaged users was propping up the economics. Dan worried that, at scale, those numbers would collapse. He made the call not to ship globally — and still believes it was the right decision.
His takeaway? “The argument wasn’t actually about the data — it was about conviction and ownership.”
That tension — between boards trying to reduce risk and operators trying to protect learning time — doesn’t go away on its own. It gets resolved by building a shared reality. And the fastest way to build a shared reality is a board-ready KPI scoreboard.
Why Do Board Meetings Fall Apart Over Growth Data?
Most growth arguments in board meetings aren’t about charts. They’re about the fact that Marketing, Product, Finance, and Data are each working from their own version of the truth. When every team can find a number that defends their position, no one is ever wrong — and nothing changes. A board-ready scoreboard fixes this by enforcing one shared set of definitions, one data source, and one owner per metric.

As Dan puts it: “Multiple sources of truth means there’s no way to be objective about outcomes. Accountability falls through the cracks.”
The fix isn’t more slides. It’s fewer numbers with clearer rules. Research from Board Intelligence and the Chartered Governance Institute found that the average board pack has grown to 226 pages, and more than half of directors struggle to find key messages in them. A scoreboard designed for decisions — not presentations — cuts through that noise.
What Are The Rules For Board-Ready KPIs?
Every metric on a board-ready scoreboard needs four things: one definition, one owner, one source of truth, and a threshold. Without all four, the metric will eventually cause more confusion than clarity. These rules keep everyone honest and keep the meeting moving.
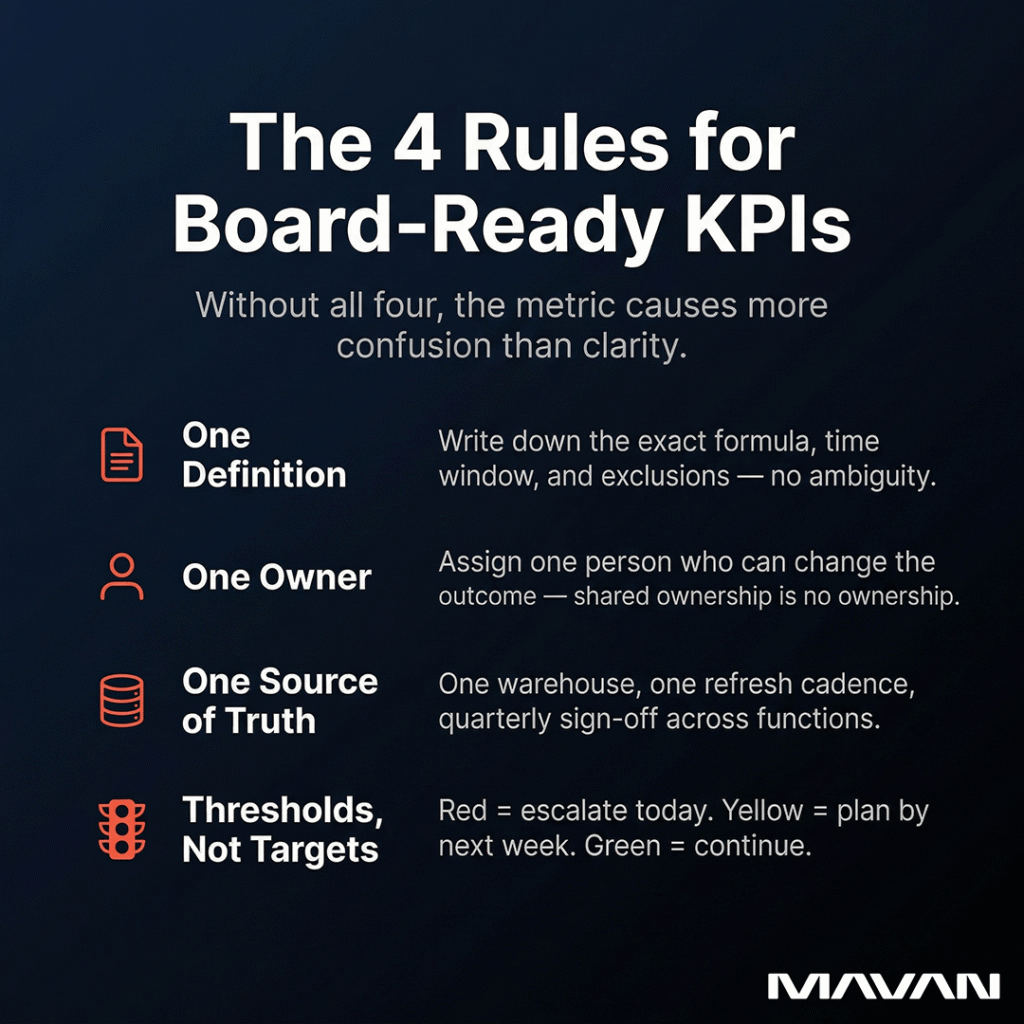
One definition means writing down exactly what the metric measures — plain-English meaning, exact formula, time window, cohort rule, and inclusions or exclusions. If “CAC” means five different things across five teams, it means nothing.
One owner means assigning a single person who is accountable for the metric’s integrity. Shared ownership usually becomes abandoned ownership — not because people are lazy, but because incentives split. Assign owners based on who can actually change the outcome: acquisition metrics go to the growth lead, funnel conversion goes to product, margin metrics go to finance.
One source of truth means one data warehouse, one refresh cadence, and a quarterly sign-off across functions. Dan was blunt about this: “You have to have a single source of truth, full stop.” When numbers disagree in a board meeting, the warehouse number is truth. Discrepancies get investigated offline. “That’s the only answer that doesn’t derail the meeting,” he explains.
Thresholds, not targets means defining red, yellow, and green as behavior triggers — not aspirations. Red means stop and escalate today. Yellow means flag it and have a plan by next week. Green means continue. Set thresholds using your last 8–12 weeks of variance: yellow is outside normal variance, and red is outside variance and financially meaningful.
Which 12 Metrics Belong on a Board-Ready Scoreboard?
A strong board scoreboard uses 12 metrics split between leading indicators (fast signal, weekly decisions) and lagging indicators (business truth, monthly confidence). Here’s what we recommend — and what we use ourselves.
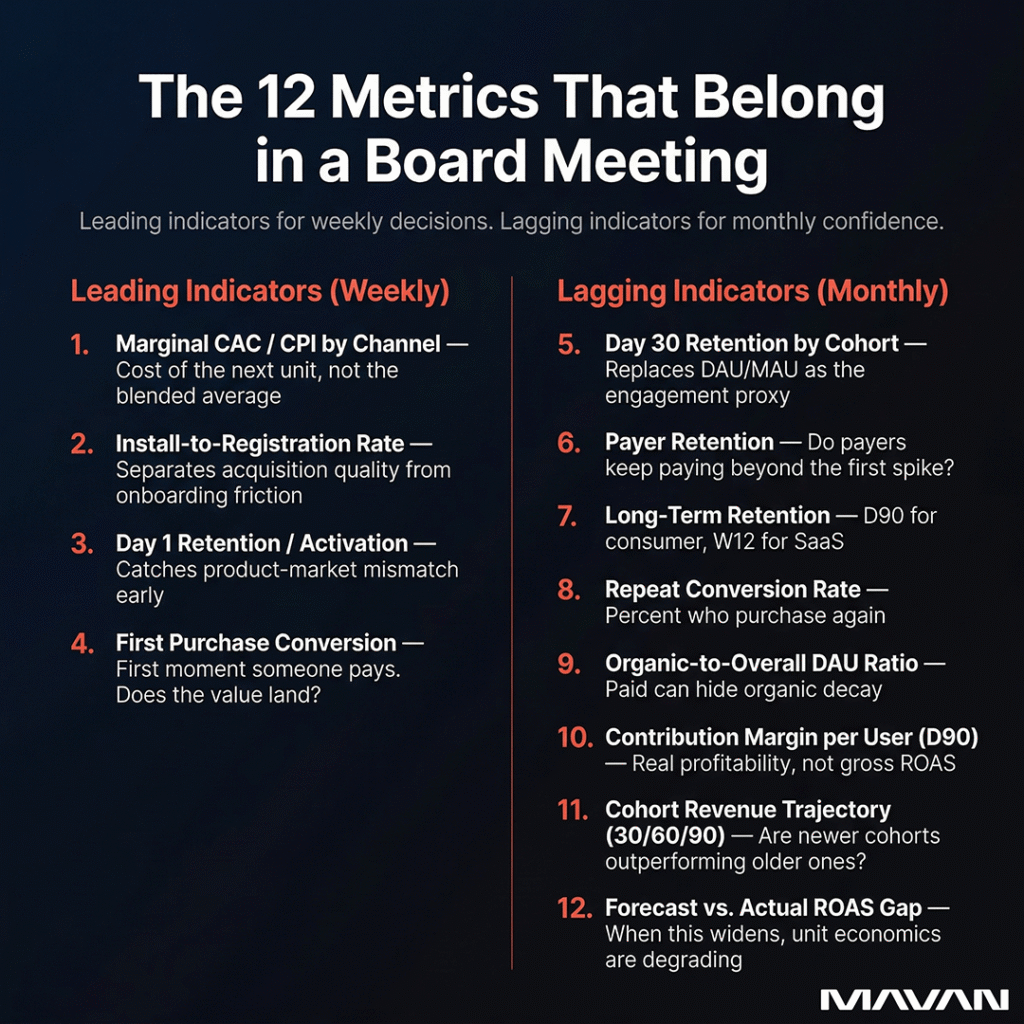
Leading indicators (weekly):
- Marginal CAC or CPI by channel — the cost of the next acquired unit, not a blended average. This tells you whether to keep spending this week.
- Install-to-registration rate (or visit-to-signup) — separates acquisition quality from onboarding friction.
- Day 1 retention or Day 1 activation — catches product-market mismatch early.
- First purchase conversion — the first moment someone pays, signaling whether the value proposition lands.
Lagging indicators (monthly):
- Day 30 retention by cohort vintage — replaces DAU/MAU as the board’s engagement proxy by tracking users acquired in a specific month and reading forward.
- Payer retention — whether payers keep paying, protecting against one-and-done revenue spikes.
- Long-term retention — Day 90 for consumer, Week 12 for SaaS, tied to your payback reality.
- Repeat conversion rate — the percent who purchase again, reflecting satisfaction better than raw sessions.
- Organic-to-overall DAU ratio — because paid can hide organic decay.
- Contribution margin per acquired user at Day 90 — replaces gross ROAS by subtracting variable costs, not just media spend.
- Cohort revenue trajectory at 30/60/90 days — shows whether newer cohorts outperform older ones, replacing month-over-month revenue growth.
- Forecast ROAS vs. actual ROAS gap — what Dan calls “one of the most honest signals” available. When this gap widens, unit economics are degrading or attribution is drifting.
How Do You Keep Board Meetings From Collapsing Into Complexity?
Even with perfect metrics, board meetings can spiral the moment someone asks “why.” Dan’s solution is the “one drill-down” rule: the board sees the top-line number, and if it’s yellow or red, one level of segmentation is allowed — by channel, by geo, or by product line. Never more than one level in the meeting itself.
This protects clarity and forces operators to do the analysis before the room arrives. We don’t outsource due diligence to a meeting that should be focused on decisions.
How Do You Build A Board-Ready Scoreboard in 14 Days?
If your next board meeting is within two weeks, you don’t need a rebuild. You need a reset you can execute under pressure.

Week 1 — Lock governance:
- Pick 12 metrics and write one definition for each.
- Assign one owner per metric.
- Set red and yellow thresholds with actions tied to each.
Week 2 — Lock rhythm:
- Run one Monday review using the scoreboard.
- Write one daily async update.
- Send the pre-read at least three days early with one “decisions needed” box.
That’s it. Choose your metrics today. Assign owners tomorrow. Send your first pre-read next week.
Does This Scoreboard Actually Work?
Measurement discipline and shared definitions drive real outcomes. We’ve seen this in our own work. With ElevenLabs, we achieved 1,000% ad spend growth at target ROAS and over 90% top impression share globally. With Fireflies, we delivered a blended 1.96× ROAS at $700K+ monthly scale, plus a 46% CAC reduction quarter over quarter.
Those results required exactly the kind of scoreboard we’ve described here: clear metrics, clear owners, and one source of truth everyone trusted.
Frequently Asked Questions About Growth Metrics and Board Meetings
What is a board-ready KPI scoreboard?
A board-ready KPI scoreboard is a single-page view of 12 metrics with shared definitions, assigned owners, one data source, and red-yellow-green thresholds tied to specific actions. It replaces competing dashboards with one shared reality designed for decisions.
How many KPIs should you show a board?
Aim for 12 total — four leading indicators reviewed weekly and eight lagging indicators reviewed monthly. Fewer is better than more. If your scoreboard doesn’t fit on one page, it has too many metrics.
What’s the difference between a target and a threshold?
Targets are aspirational goals. Thresholds are operational triggers. Red means escalate today, yellow means have a plan by next week, green means continue. Thresholds drive behavior; targets measure ambition.
Why does “one owner per metric” matter so much?
When ownership is shared, accountability disappears. One owner means one person is responsible for bringing that metric to the meeting with a clear explanation — no hedging, no hand-waving.
How do you handle conflicting numbers in a board meeting?
Designate one data warehouse as truth. Any discrepancies get investigated offline. As MAVAN President Dan Barnes puts it, that’s the only answer that doesn’t derail the meeting.
Can you build a board-ready scoreboard in two weeks?
Yes. Week one: define metrics, assign owners, set thresholds. Week two: run your first Monday review, write async updates, send the pre-read three days early. You don’t need new tools — you need new rules.
How to Build a Board-Ready KPI Scoreboard
A board-ready scoreboard isn’t just a dashboard — it’s a decision-making system. It uses 12 metrics with one definition each, one owner each, one source of truth, and thresholds that trigger specific actions. Build it in two weeks by locking governance first and rhythm second. The goal is one shared reality that boards and operators can both trust.
If your board meetings keep circling the same arguments — and you know the real issue is conflicting data, unclear ownership, or too many dashboards — then start by picking your 12 metrics and assigning one owner to each today.
And if you want a team that will embed into your organization and install this system alongside you — strategy plus execution, not a deck that disappears — contact MAVAN today. We’ll align on your growth goals, pressure points, and measurement reality, then show you what it looks like to build a scoreboard your board can actually trust.
Casey Rock is Content Director at MAVAN, where he helps turn complex ideas into clear, strategic content that drives growth. With over 15 years of experience across content strategy, SEO, media, and digital marketing, Casey focuses on building content systems that connect audience insight, brand storytelling, and measurable business outcomes.
Book a complimentary consultation with one of our experts
to learn how MAVAN can help your business grow.
Want more growth insights?
Thank you! form is submitted
[hubspot type=”form” portal=”20951211″ id=”9c538ed2-fb12-45f1-a573-ad7953c058cc”]
Related Content
-

Are Mobile Game Web Shops A Growth Lever In 2026?
After Apple’s IDFA changes, mobile game studios grow by launching a web shop — a game-branded web store they own. It reclaims the 15 to 30 percent that app stores take on every purchase and rebuilds the first-party player data that makes user acquisition work again.
-

How Do You Avoid Hiring A Bad First Growth Hire?
Most first growth hires fail because the person is dropped into a company with no working system to sharpen, not because they lack talent. The fix is to build the system first — document what already drives growth, or embed a growth pod to turn scrappy channels into a coordinated system with a 90-day playbook — then make your senior hire, so they inherit a working machine instead of a blank page.
-

How Do You Use AI For Winning Ads In Creative Development?
AI’s biggest near-term payoff in growth is creative. Use it to generate more concepts and rebuild what already works — then rely on human taste, audience truth, and disciplined testing to decide which creative ships and scales.