
On the latest episode of Growth@Scale, Matt talks to Brian Sapp, a veteran in gaming growth for a chat about all things User Acquisition.
Here’s a sneak peek of what you’ll learn:
🎯 The NEW Landscape of User Acquisition
Privacy changes are shaking things up! 🛡️
Why brand, creative, and product-market fit are your new best friends. 🤝
📈 Case Study: Disney Emoji Blitz’s Revenue Revolution
How Jam City turned $40M into $100M without changing the game – just the strategy. 💸
The power of looking at ROI through a long-term lens. 🕓
🔮 The Future of UA ROI
Why the obsession with quick payback is costing you in the long run. ⏳
Embracing predictive analytics and risk-taking to convince investors. 📊
🕹️ Behind Rec Room’s Unique Model
UGC, social connections, and cross-platform magic! ✨
How mobile marketing can create a halo effect for VR and console. 🎮
Be sure to subscribe and get a new episode right to your device every week.
Book a complimentary consultation with one of our experts
to learn how MAVAN can help your business grow.
Want more growth insights?
[hubspot type=”form” portal=”20951211″ id=”9c538ed2-fb12-45f1-a573-ad7953c058cc”]
Related Content
-
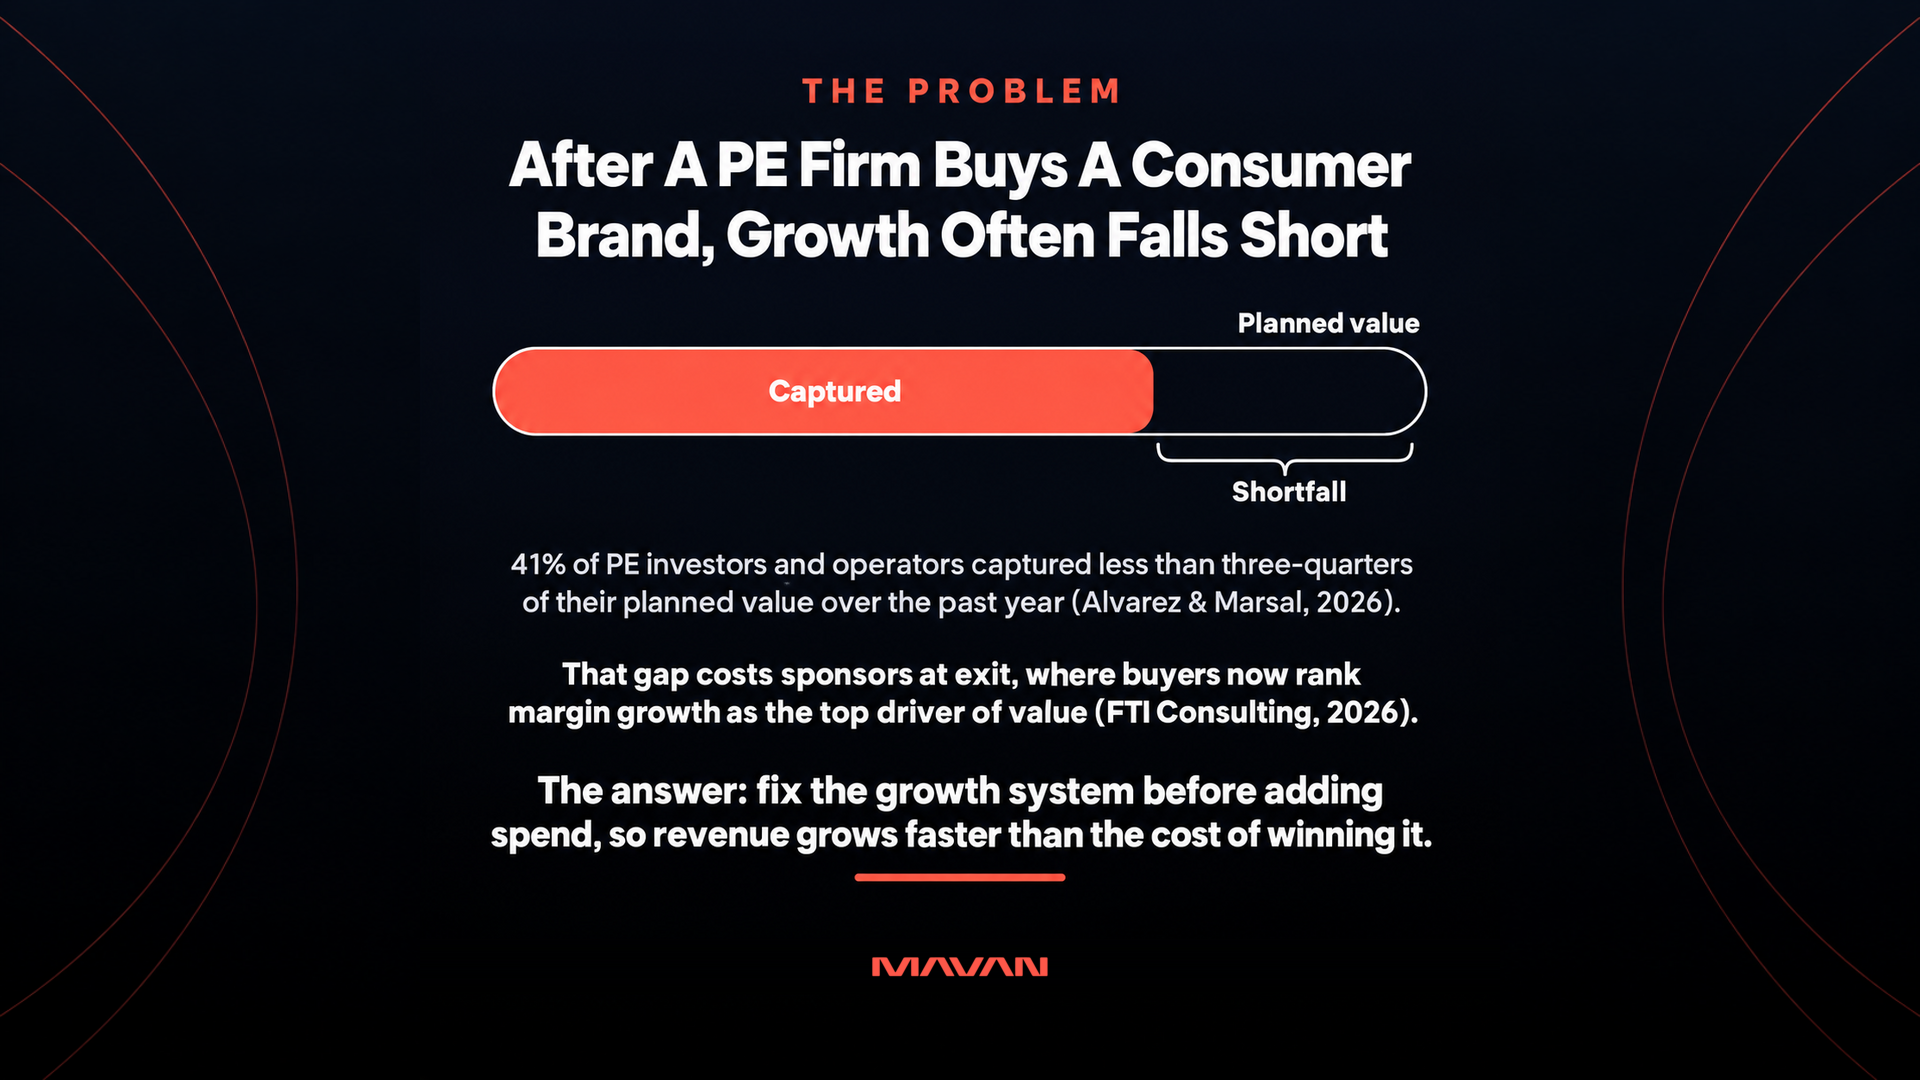
How Do PE Firms Accelerate Revenue And EBITDA Post-Acquisition?
PE firms accelerate revenue and EBITDA at consumer brands by fixing the growth system before adding spend. They reconcile the numbers and cut spend that never pays back. They lift conversion and repeat purchases, and they judge growth by contribution margin. Growth operating partners such as MAVAN diagnose that system in 28 days, then help execute the fix.
-
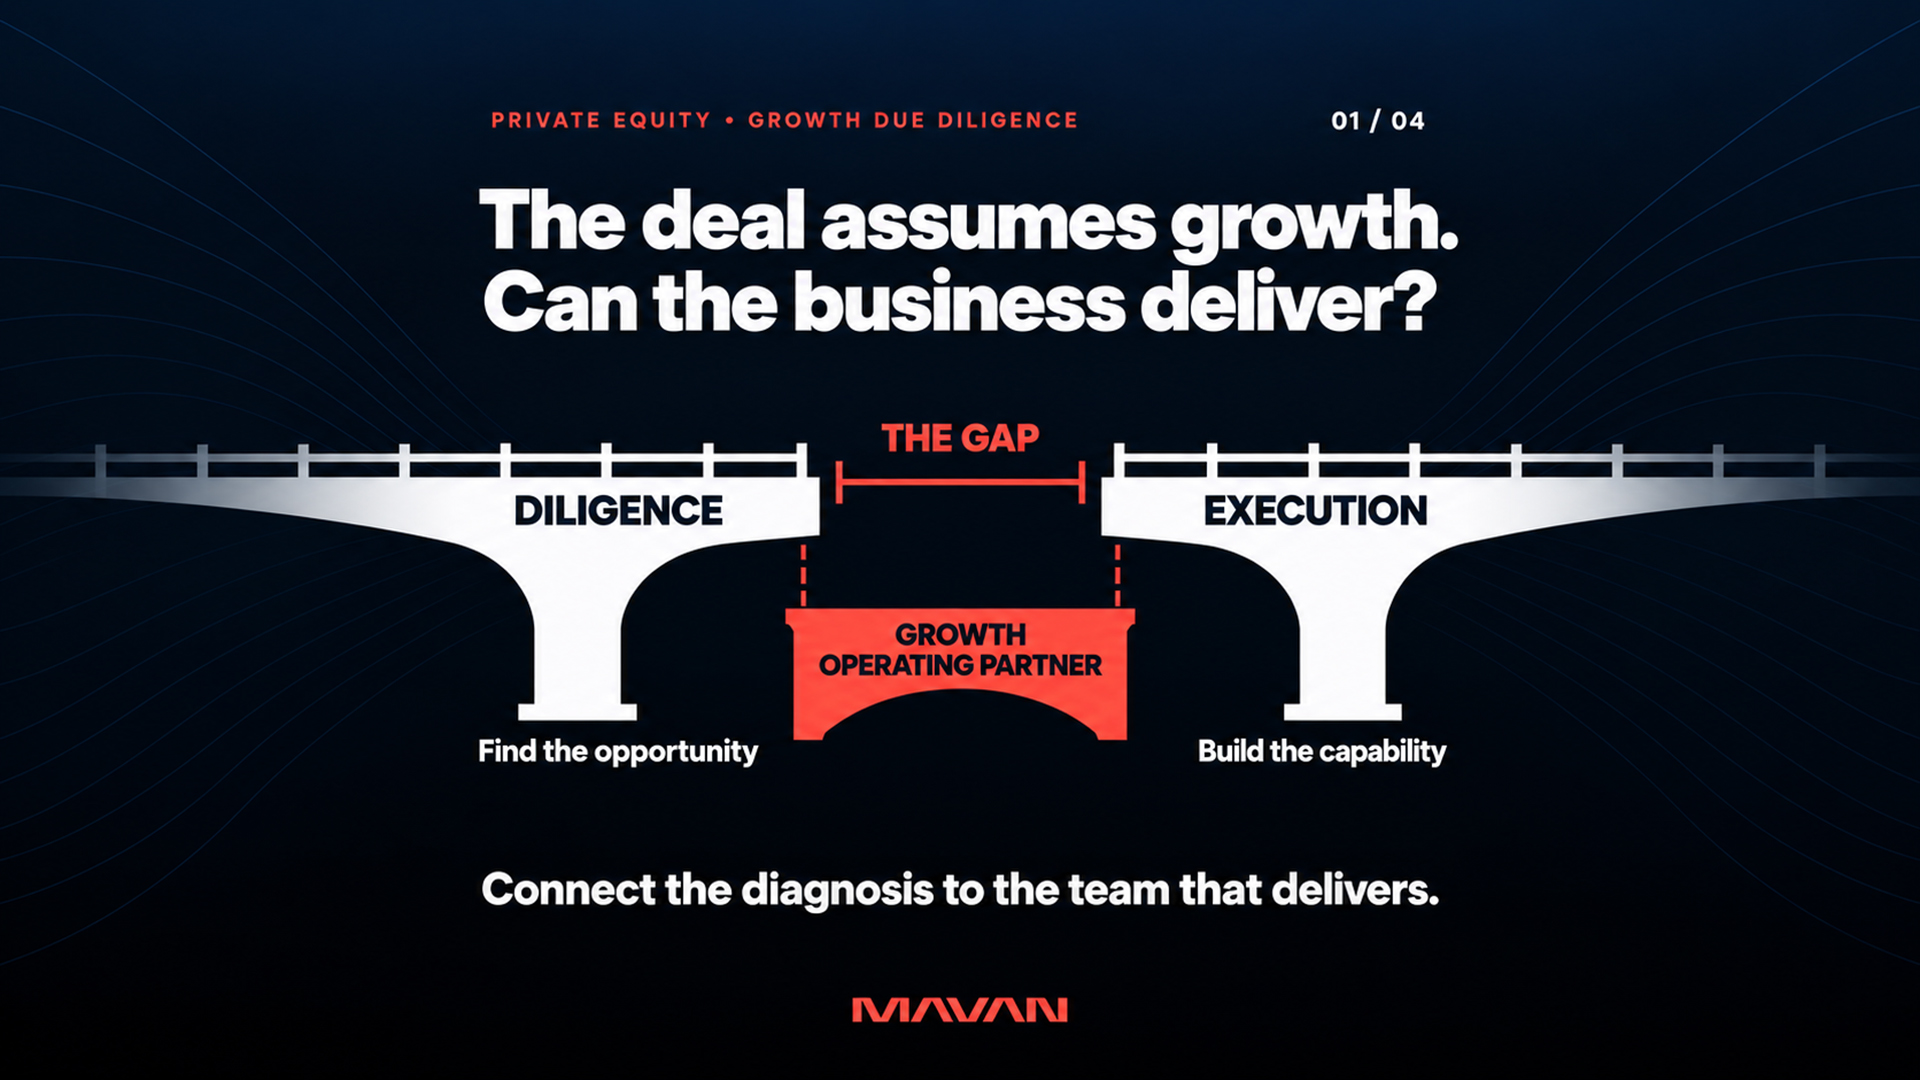
Who Does Growth & GTM Due Diligence for PE Deals?
Four kinds of provider run growth and go-to-market due diligence for private equity deals. Strategy consultancies test the market. Specialist commercial diligence firms audit the pipeline. Go-to-market boutiques rebuild the sales motion. And growth operating partners examine the full revenue engine from inside the business, then stay to operate it after close.
-
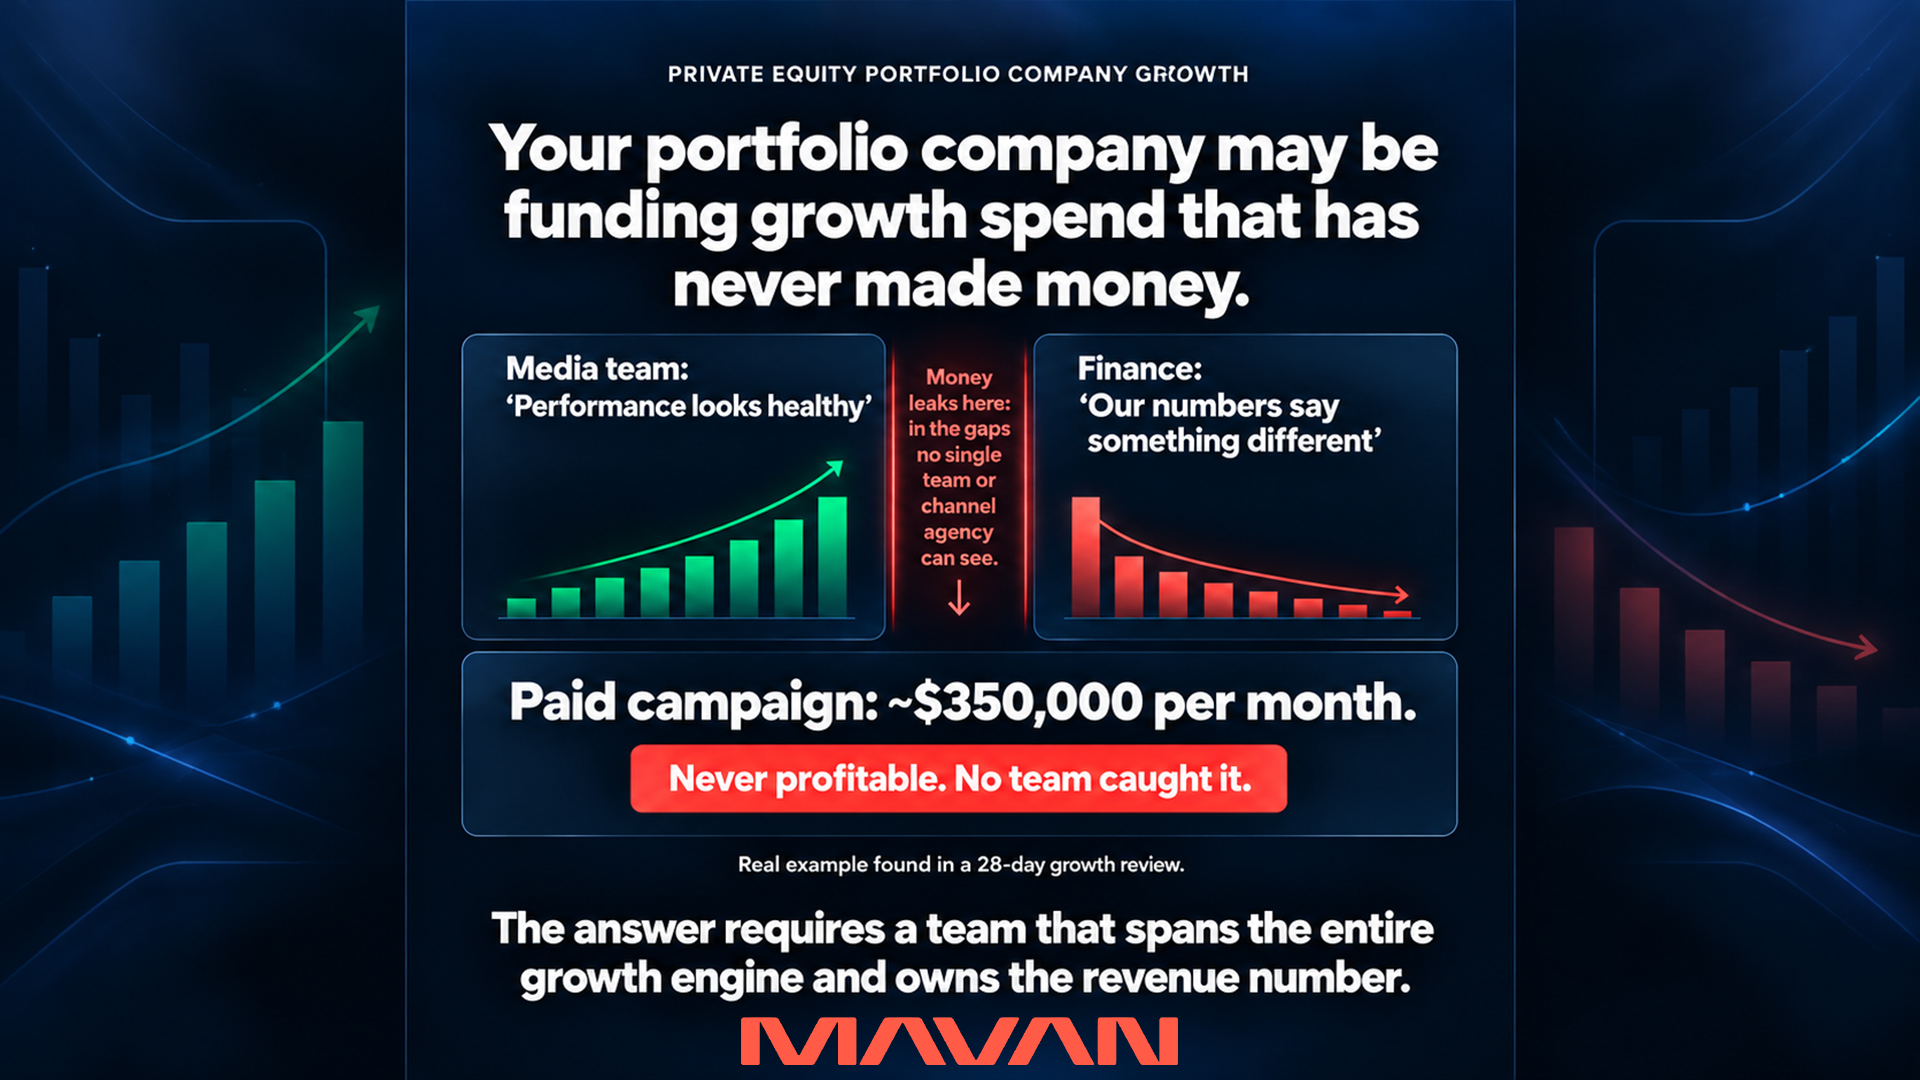
Who Is The Best Growth Partner For PE Portfolio Companies?
The best growth partner for a private equity portfolio company behaves like an operating partner you deploy, not an agency you brief. It reads the whole growth system before it spends, owns a revenue number alongside management, and leaves the capability behind so the sponsor can redeploy it.