
To solve SKAN attribution for multi-channel apps, fix your conversion-value and revenue configuration first, then triangulate SKAN with incrementality testing and one internal source of truth — so every channel gets measured against the same number.
TLDR — How To Solve SKAN Attribution For Multi-Channel Apps
- SKAN usually isn’t broken — it’s misconfigured, and asked to do a job it can’t.
- One audit capped tracked revenue at $20 while whales spent hundreds — dashboards lied.
- Since iOS 14.5, SKAN is your only signal when users decline ATT (most do).
- Map conversion values to revenue-predicting events, not vanity session counts.
- Widen revenue bands ($0–$5 / $5–$50 / $50–$200) so whales stop looking average.
- Align postbacks to your monetization curve; keep CV null rate under 10%.
- SKAN can’t be your source of truth — it’s last-touch, per-network, thresholded.
- Triangulate: attribution (daily), incrementality (proof), MMM (budget) check each other.
- Reconcile it all into one number finance, product, and growth share.
- See exactly where your setup leaks money — check out our 360 Growth Analysis.
One MAVAN SKAN audit opened on a mobile game that looked healthy on every dashboard. The problem sat one layer down: the setup capped each user’s tracked revenue at $20, while the game’s best players were spending hundreds. The reports glowed green. The bank account told a different story. That gap — between what your dashboard reports and what truly lands in revenue — is the real SKAN problem, and it is more fixable than most growth teams believe.
If you run paid user acquisition across Meta, Google, AppLovin, and a few experimental channels, you have likely felt this. The data arrives late, arrives grouped, and rarely agrees with itself. Here’s the thing though: SKAN is almost never the thing that’s broken — the configuration is, and the way teams ask SKAN to do a job it was never built for. Fix those two things and you get back to the work you want to be doing: scaling spend you can trust.
What Is SKAN, and Why Does Multi-Channel Attribution Feel Broken?
SKAdNetwork (SKAN) is Apple’s privacy-first framework for measuring iOS ad campaigns without identifying individual users. It reports aggregated, deterministic results — you learn which campaigns worked, not who converted. Since iOS 14.5, when a user declines App Tracking Transparency (ATT), SKAN is the only signal an advertiser gets. In 2026, that describes most iOS users.
The scale of the shift is easy to underrate. Adjust’s Q2 2025 benchmark puts the industry-wide ATT opt-in rate near 35% of users who are shown the prompt — and many users never see one at all. So the majority of your iOS ad exposure produces no user-level data. SKAN fills that gap, but it comes with three constraints that make multi-channel measurement feel hostile: data is aggregated to protect anonymity, it can arrive up to 35 days after the install, and it credits the last touch only.
Sam McLellan, VP of Growth at MAVAN, has watched this reshape the entire discipline. “Attribution becomes such an extremely complicated thing,” he notes, “where it used to be everyone just kind of accepted last touch and just went with it.” The tools now hand you a choice you may not know you’re making. As McLellan describes it, platforms like AppsFlyer include “levers to kind of toggle between — do you want us to figure it out, or do you want us to only report what Apple is saying using their SKAN network. And it has gates and signal density and things you have to hit in those gates in order to get enough data to come in.” Miss those gates, and the data comes back as one anonymized lump — or not at all.
Is SKAN Actually Broken, or Just Misconfigured?
Most of the time, SKAN is misconfigured, not broken. The gap between what your mobile measurement partner (MMP) reports and what your revenue actually shows is largely a configuration problem — undersized revenue bands, a conversion-value schema built for the wrong events, and postback windows that don’t match how users monetize. The mechanics work. The setup is what’s leaving money invisible.
Return to that capped-at-$20 audit. The game was running a six-bit conversion value — the numeric code SKAN uses to describe what a user did after installing. But it pointed that code at events that told an unclear story, and squeezed all revenue into a single $20 ceiling. Every whale looked identical to a mid-spender. MAVAN’s fix expanded revenue tracking from a $20 maximum to a $200 maximum and rebuilt the value bands (low $0–$5, mid $5–$50, high $50–$200). That single change delivered a 10x improvement in revenue tracking capability and, with it, the ability to bid toward the users who pay.
This is not a fringe finding. Industry analysis in 2026 lands in the same place: the ROAS gap between what your MMP reports and what your bank account sees on iOS is, more than anything, a SKAN misconfiguration problem. The comforting part is what it implies. You are not waiting on Apple to rescue your measurement. The highest-leverage attribution work most app teams can do this quarter is a configuration audit they already have the access to run.
How Do You Configure SKAN Conversion Values to Capture Real Revenue?
Configure SKAN by mapping conversion values to the events and revenue that predict real user value, widening revenue bands to capture high spenders, and aligning postback windows to your monetization curve. The goal is a clean line from a conversion value to a dollar figure — so every campaign optimizes toward revenue, not toward installs that never pay.
Here is the sequence MAVAN uses on an audit. Each step stands on its own, so you can start wherever your setup is weakest.
- Map conversion values to value, not vanity. Tie your fine conversion values to a progression that predicts revenue: install, registration, tutorial complete, early engagement milestones, then revenue bands. Milestones like reaching level 5, level 20, and level 50 tell you far more than a raw session count.
- Widen your revenue bands to fit your top spenders. If your ceiling is $20 and your best users spend $200, you are blind to the people funding the business. Segment revenue into meaningful tiers (for example, $0–$5, $5–$50, $50–$200) so high-value cohorts show up as high value.
- Align postback windows to how users actually pay. SKAN 4 gives you three windows — roughly day 0–2, day 3–7, and day 8–35. Match your event and revenue signals to when monetization happens in your app, not to a generic template.
- Watch your conversion-value null rate. A CV null rate under 10% is generally healthy; above it, you are losing signal to Apple’s anonymity thresholds. In the audit above, a null rate near 10% was rated excellent — a benchmark worth defending as you scale.
- Validate before you scale. Confirm postback receipt and even distribution across your conversion values in your MMP dashboard before you pour budget in. Bad data scaled is just expensive bad data.
Done well, this connects the dots that SKAN otherwise hides. As McLellan puts it, the bare minimum is non-negotiable before a dollar goes out: “You’re gonna need the attribution. You need to know where the money you’re spending is.”
Why Can’t SKAN Be Your Single Source of Truth for Multi-Channel Apps?
SKAN can’t be your single source of truth because it measures one network at a time, credits only the last touch, and hides the multi-touch journeys that define real app growth. A user who watches a Meta ad, then installs from an AppLovin playable, looks like an AppLovin install to SKAN. The channel that created the demand gets none of the credit.
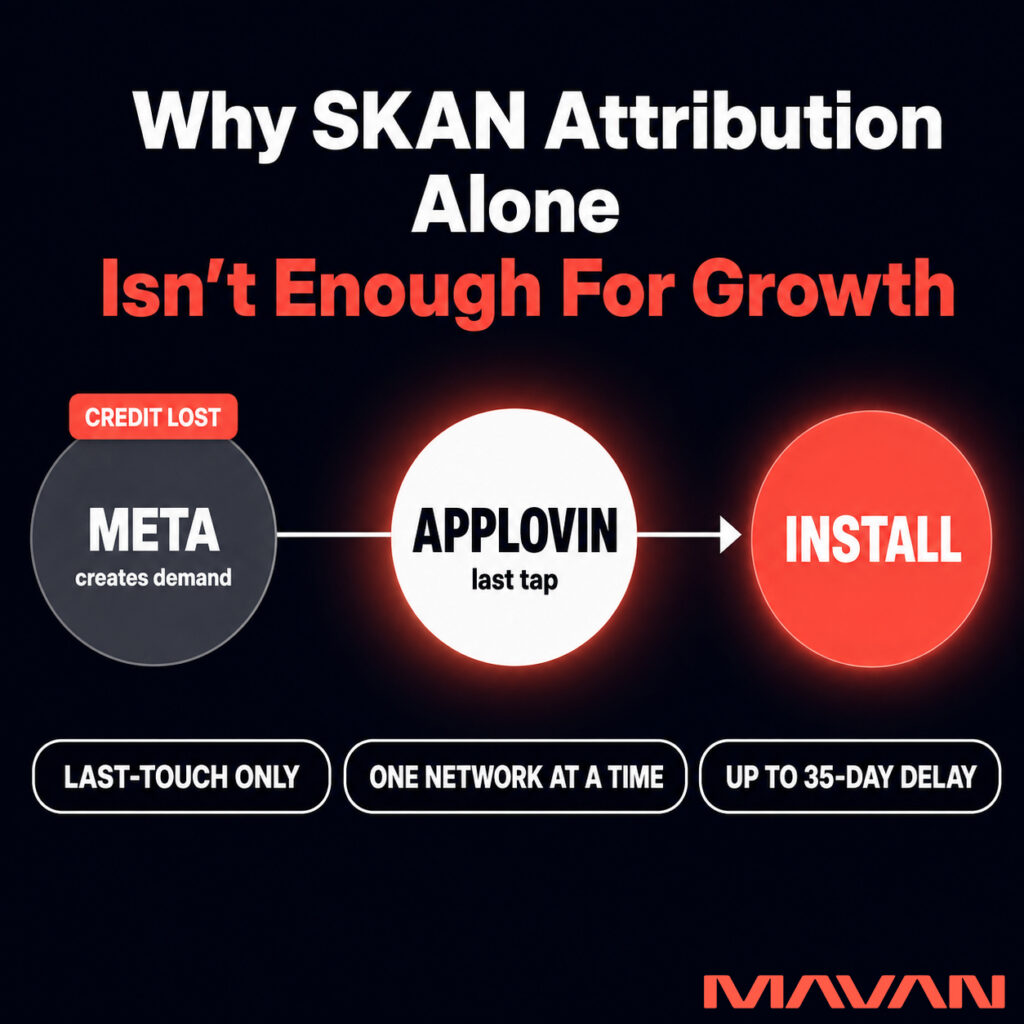
McLellan sees this pattern constantly in bigger accounts. “At some point they want to know, of that money I spent, what does that user journey look like? Is it Meta to Google, or is it AppLovin and they installed from a playable?” The Meta ad may never convert directly, he explains — “but once everyone sees it and watches how cool the game is, that’s driving the education,” while the playable becomes the final tap. To see that, MAVAN builds custom models: “We build these attribution systems that attribute across multiple touch points.”
There is a second wall, and it is the one that caps smaller budgets hardest: signal density. SKAN only returns granular data once a segment clears Apple’s anonymity thresholds. Spend too little in too many places and every segment falls short. McLellan’s guidance is to trade granularity for reliability until your budget earns it back. “You can’t just spend the money and hope that it comes back,” he says. “You have to have a system you can actually rely on for that data — and trust that data — have a single source of truth.” The practical move is geo-grouping: rather than treating every country separately, “you might do all the European countries, and that gives you enough signal density you can actually scale.” Perfect attribution is a mirage anyway. As McLellan frames it, the further out you get in spend, the sharper the picture — “the more you spend, the more accurate it is” — so you build for confident decisions, not for a certainty that doesn’t exist.
How Do You Triangulate SKAN With Incrementality and MMM?
You triangulate by pairing three methods that answer different questions: attribution for daily, tactical signal; incrementality testing for causal proof of what your ads caused; and marketing mix modeling (MMM) for the strategic, cross-channel picture. Each method checks the others. When SKAN and a geo-holdout test disagree, the gap tells you exactly where to look.
| Method | What It Answers | When to Lean On It |
|---|---|---|
| Attribution (SKAN) | Which campaign or creative got the credit? | Daily, tactical optimization within channels |
| Incrementality | What did my spend actually cause? | Proving a channel’s true lift, one or two big channels at a time |
| MMM | Where should the next dollar go? | Strategic budget allocation across all channels |
The three do distinct jobs. Attribution — including SKAN — tells you which campaigns and creatives got the credit day to day. Incrementality testing answers the harder question: what would have happened anyway? You pause a channel in a set of matched markets, hold spend steady elsewhere, and measure the true lift. MMM models how all your inputs drive outcomes across channels over one- to three-month cycles, giving you a budget-level view that survives privacy loss. The industry has moved this way fast — in a 2026 EMARKETER and TransUnion survey, 27.6% of US marketers rated MMM their most reliable method, ahead of multi-touch attribution at 19.4%. And the causal layer earns its keep: across a dataset of 225 well-designed geo and holdout experiments, the median incremental return on ad spend came in at 2.31.
For a deeper walkthrough of how these three methods reinforce each other, we broke it down in our guide to measuring which marketing spend really works. The short version: SKAN tells you what got the credit, incrementality tells you what your spend truly caused, and MMM tells you where the next dollar should go. Held together, they close the gap that a single privacy-limited signal leaves open — and they let you keep scaling channels like creative-led playables that a last-touch model would badly undervalue. (We make a related case in why creative is the biggest acquisition lever.)
What Is an Internal Source of Truth, and Why Does Your Board Need One?
An internal source of truth (iSoT) is one agreed number, with one definition and one owner, that finance, product, and growth all argue from. It sits above any single platform’s reporting. Without it, every team brings its own dashboard to the meeting, and no one can be objectively right or wrong — which means nothing gets decided.
This is where SKAN stops being a UA problem and becomes a boardroom problem. Dan Barnes, President of MAVAN, has run enough growth reviews to name the failure mode precisely. His rule for any board-ready KPI is short: “One definition. One owner. One source of truth. And a threshold, not a target.” The stakes are higher than tidy reporting. “Multiple sources of truth means there’s no way to be objective about outcomes,” Barnes says. “And when you can’t be objective about outcomes, accountability falls through the cracks. Everyone can always find a number that defends their position, which means no one is ever actually wrong, which means nothing changes.”
Barnes also names the risk that ATT made real for every app: platform fragility. “Most performance marketing is built on one or two channels performing,” he notes. “When platform policy changes or auction dynamics shift, the entire growth model can reprice overnight.” That is the story of iOS 14.5 in a sentence. The defense is not more dashboards. It is one warehouse number that finance and product both use. When SKAN reports one figure and a channel reports another, the answer stays calm: the source of truth is truth, and the discrepancy gets investigated offline. Telling a CFO “Meta says 4.8x” is not proof. One reconciled number is what turns an argument into a decision. This same measurement-first discipline runs through the two questions MAVAN President Dan Barnes says every growth org should answer.
How Has MAVAN Helped Apps Scale When Attribution Felt Broken?
MAVAN has helped venture-backed apps turn shaky measurement into confident, profitable scale by rebuilding attribution logic first and spending second. The pattern repeats: fix the source of truth, add incrementality measurement, then push budget into the clarity that creates. Two client outcomes show the arc.
ElevenLabs, the AI audio company, partnered with MAVAN to scale paid search profitably across borders. Rather than chase reported ROAS, our team scaled on positive incremental ROI — the lift that spend actually caused — while holding a consistent sub-12-month payback. MAVAN scaled ElevenLabs’ Search spend from zero to a high-six-figure monthly budget and expanded into 20-plus international markets, each launched at positive incremental ROI. “Within months, MAVAN scaled our Search spend to a high six-figure monthly budget, maintaining efficiency consistently for nearly a year,” said Luke Harries, Head of Growth at ElevenLabs. “After we had proven the channel with MAVAN, we were able to confidently transition the program to our in-house team.”
Titan came to MAVAN needing to reduce CAC, rebuild its tracking infrastructure, and find scalable channels — the exact stack of problems SKAN misconfiguration creates. MAVAN rebuilt Titan’s tracking and measurement infrastructure to sharpen visibility into paid performance, then scaled on the clarity that created: a 3x reduction in CAC while growing paid acquisition volume 5x. “It truly felt like MAVAN was part of our in-house team,” said Angus Kirby, Director of Marketing at Titan. “MAVAN actually executed.” You can read more client outcomes on our case studies page.
The through-line matters more than any single number. Neither team scaled by finding a magic channel. They scaled because they could finally trust what their measurement told them — and trustworthy measurement is a system you build, not a setting you flip.
Frequently Asked Questions About SKAN Attribution
Does SKAN work if a user declines the ATT prompt?
Yes. SKAN operates independently of ATT consent. Even when a user declines tracking, SKAN still delivers anonymous, aggregated attribution data for that install. That is precisely why it matters — with opt-in rates near 35% of prompted users in 2025, SKAN covers the majority of iOS installs that produce no user-level signal.
What is a good SKAN conversion-value null rate?
Under 10% is generally considered healthy. A null rate below that ceiling means most of your installs are clearing Apple’s crowd-anonymity thresholds and returning usable conversion values. When the rate climbs higher, you are losing signal — usually because segments are too small or spend is spread too thin to meet the threshold.
How many postback windows does SKAN 4 give you?
Three. SKAN 4 delivers postbacks across roughly day 0–2, day 3–7, and day 8–35 after install. The first window can carry a fine conversion value with 64 possible values; the later windows return coarser data. Aligning your event and revenue signals to these windows is central to a clean setup.
Can you do multi-touch attribution with SKAN alone?
No. SKAN credits the last touch within a single network and hides cross-channel journeys. To see how channels work together — a Meta view that leads to an AppLovin install, for example — you need supplementary models built on top of SKAN, plus incrementality testing to confirm what each channel actually caused.
How much ad spend do you need for reliable SKAN signal?
It depends on how granular you want to be. Larger budgets clear Apple’s anonymity thresholds at the geo or campaign level; smaller budgets do not. The fix for lean budgets is to reduce granularity — group markets (for example, all of Western Europe) until each segment carries enough volume to return trustworthy data.
Is SKAN going away with AdAttributionKit?
SKAN remains operational, primarily on version 4. Apple has introduced AdAttributionKit (AAK) as its longer-term successor, adding capabilities like re-engagement measurement. AAK does not replace SKAN overnight, but it is the framework to plan toward as future iOS updates roll out.
Solve SKAN Attribution For Multi-Channel Apps With 3 Things
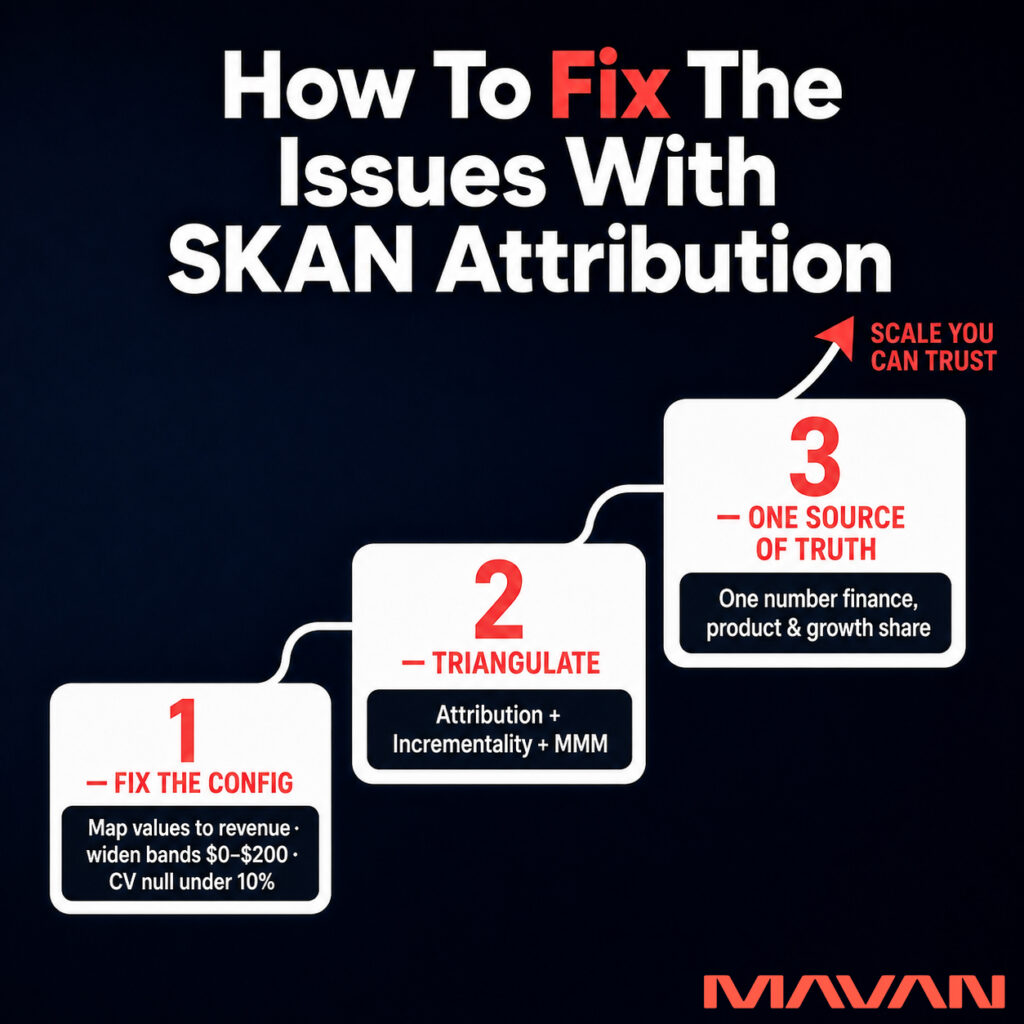
Solving SKAN attribution starts with a reframe: SKAN usually isn’t broken, it’s misconfigured — and it was never meant to be your only source of truth. First, fix the setup by mapping conversion values to real revenue, widening your revenue bands, and aligning postback windows to how users pay. Second, stop asking SKAN to measure everything alone: triangulate it with incrementality testing and marketing mix modeling. Third, reconcile all of it into one internal source of truth that finance, product, and growth share. That combination turns delayed, fragmented signal into decisions you can defend — and scale on.
The 3 Things To Do To Solve SKAN Attribution For Multi-Channel Apps:
- Fix the setup: Map conversion values to real revenue, widen revenue bands, and align postback windows with user payment behavior.
- Triangulate the signal: Combine SKAN with incrementality testing and marketing mix modeling.
- Create one source of truth: Reconcile the data into a shared internal system for finance, product, and growth.
If your dashboards and your revenue keep disagreeing, you don’t need a new tool — you need a clear read on where your measurement is leaking. If you want to know exactly where your SKAN setup and multi-channel attribution are losing money, then start with a 360 Growth Analysis — MAVAN audits your configuration, attribution logic, and source of truth, and hands you the specific fixes worth making first.
Casey Rock is Content Director at MAVAN, where he helps turn complex ideas into clear, strategic content that drives growth. With over 15 years of experience across content strategy, SEO, media, and digital marketing, Casey focuses on building content systems that connect audience insight, brand storytelling, and measurable business outcomes.
Book a complimentary consultation with one of our experts
to learn how MAVAN can help your business grow.
Want more growth insights?
Thank you! form is submitted
[hubspot type=”form” portal=”20951211″ id=”9c538ed2-fb12-45f1-a573-ad7953c058cc”]
Related Content
-
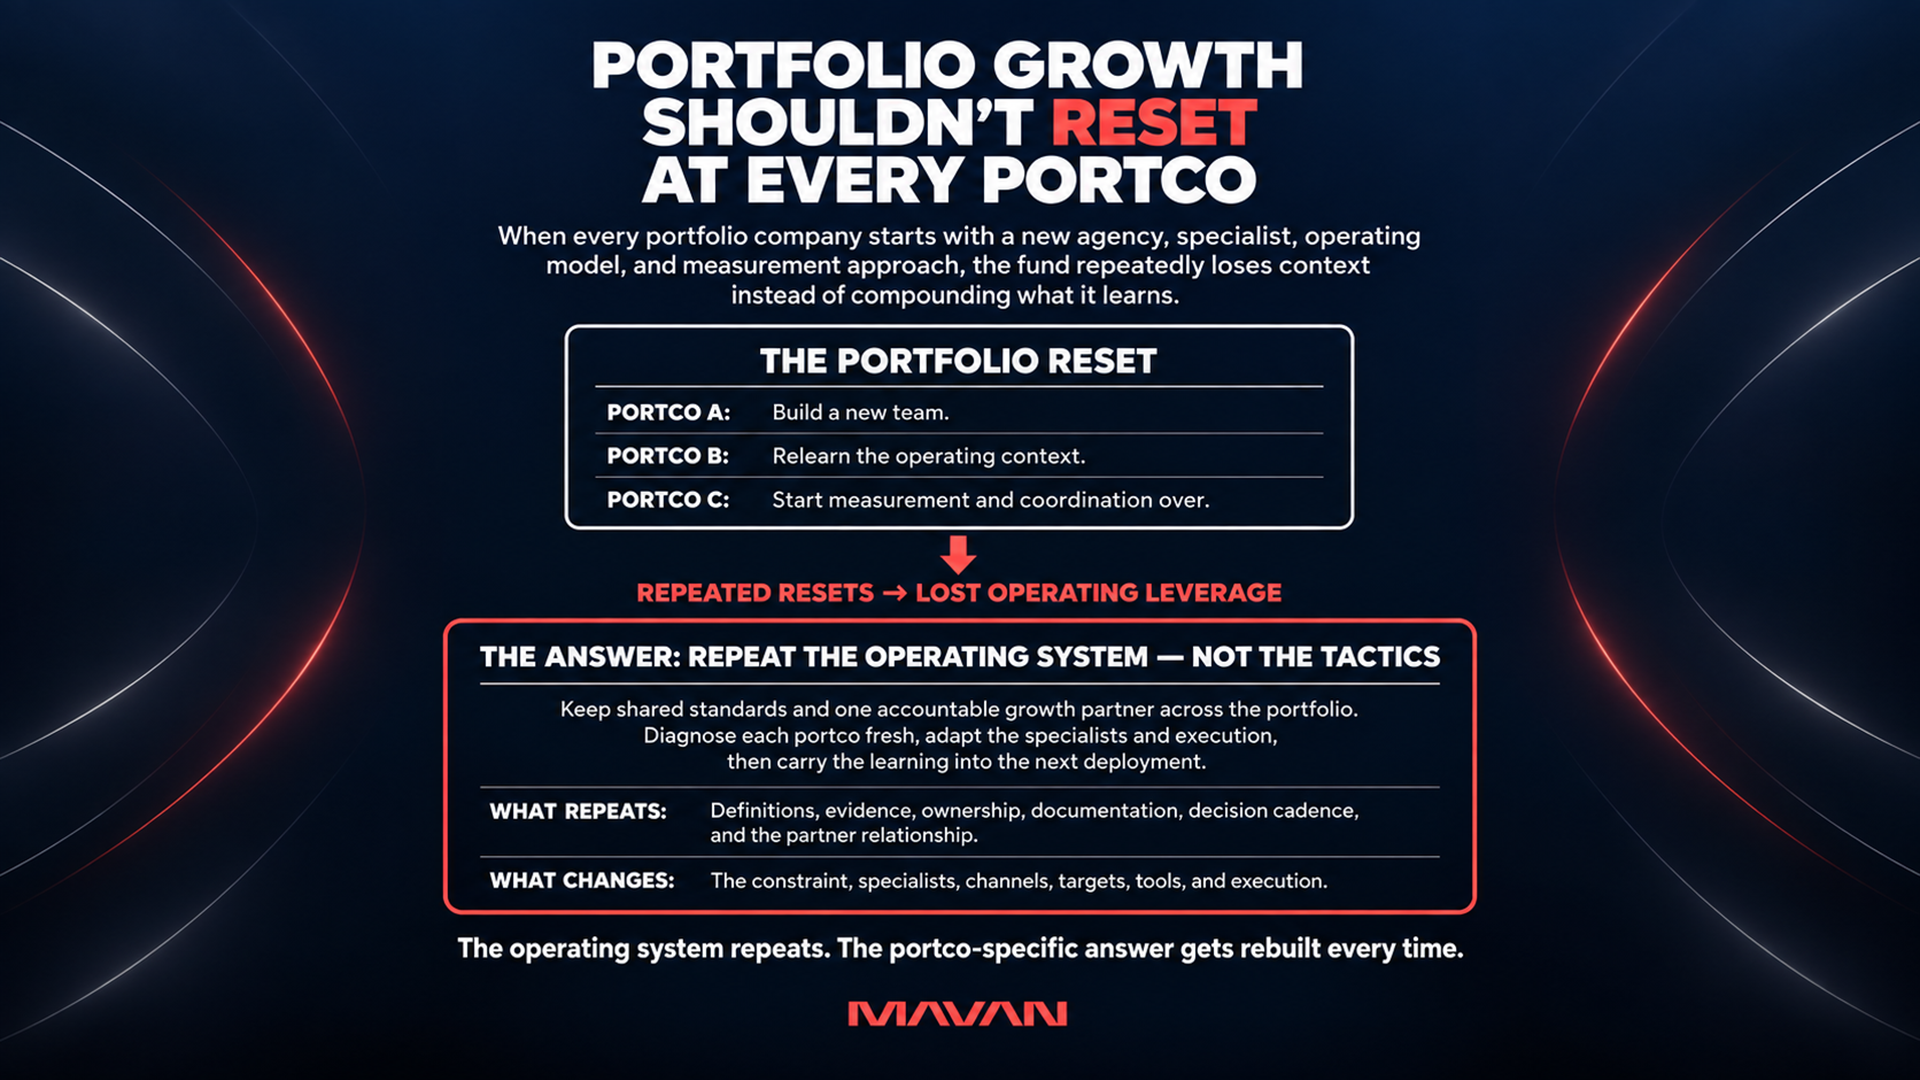
How Can Private Equity Funds Repeat Growth Across Portfolio Companies?
Growth becomes repeatable across a VC or PE portfolio when the fund installs one operating system instead of referring each company to a different specialist. The system has three parts: a single source of truth every team trusts, a board-ready scoreboard of ten to twelve metrics, and an embedded pod that diagnoses the real constraint in ninety days before anyone spends more.
-
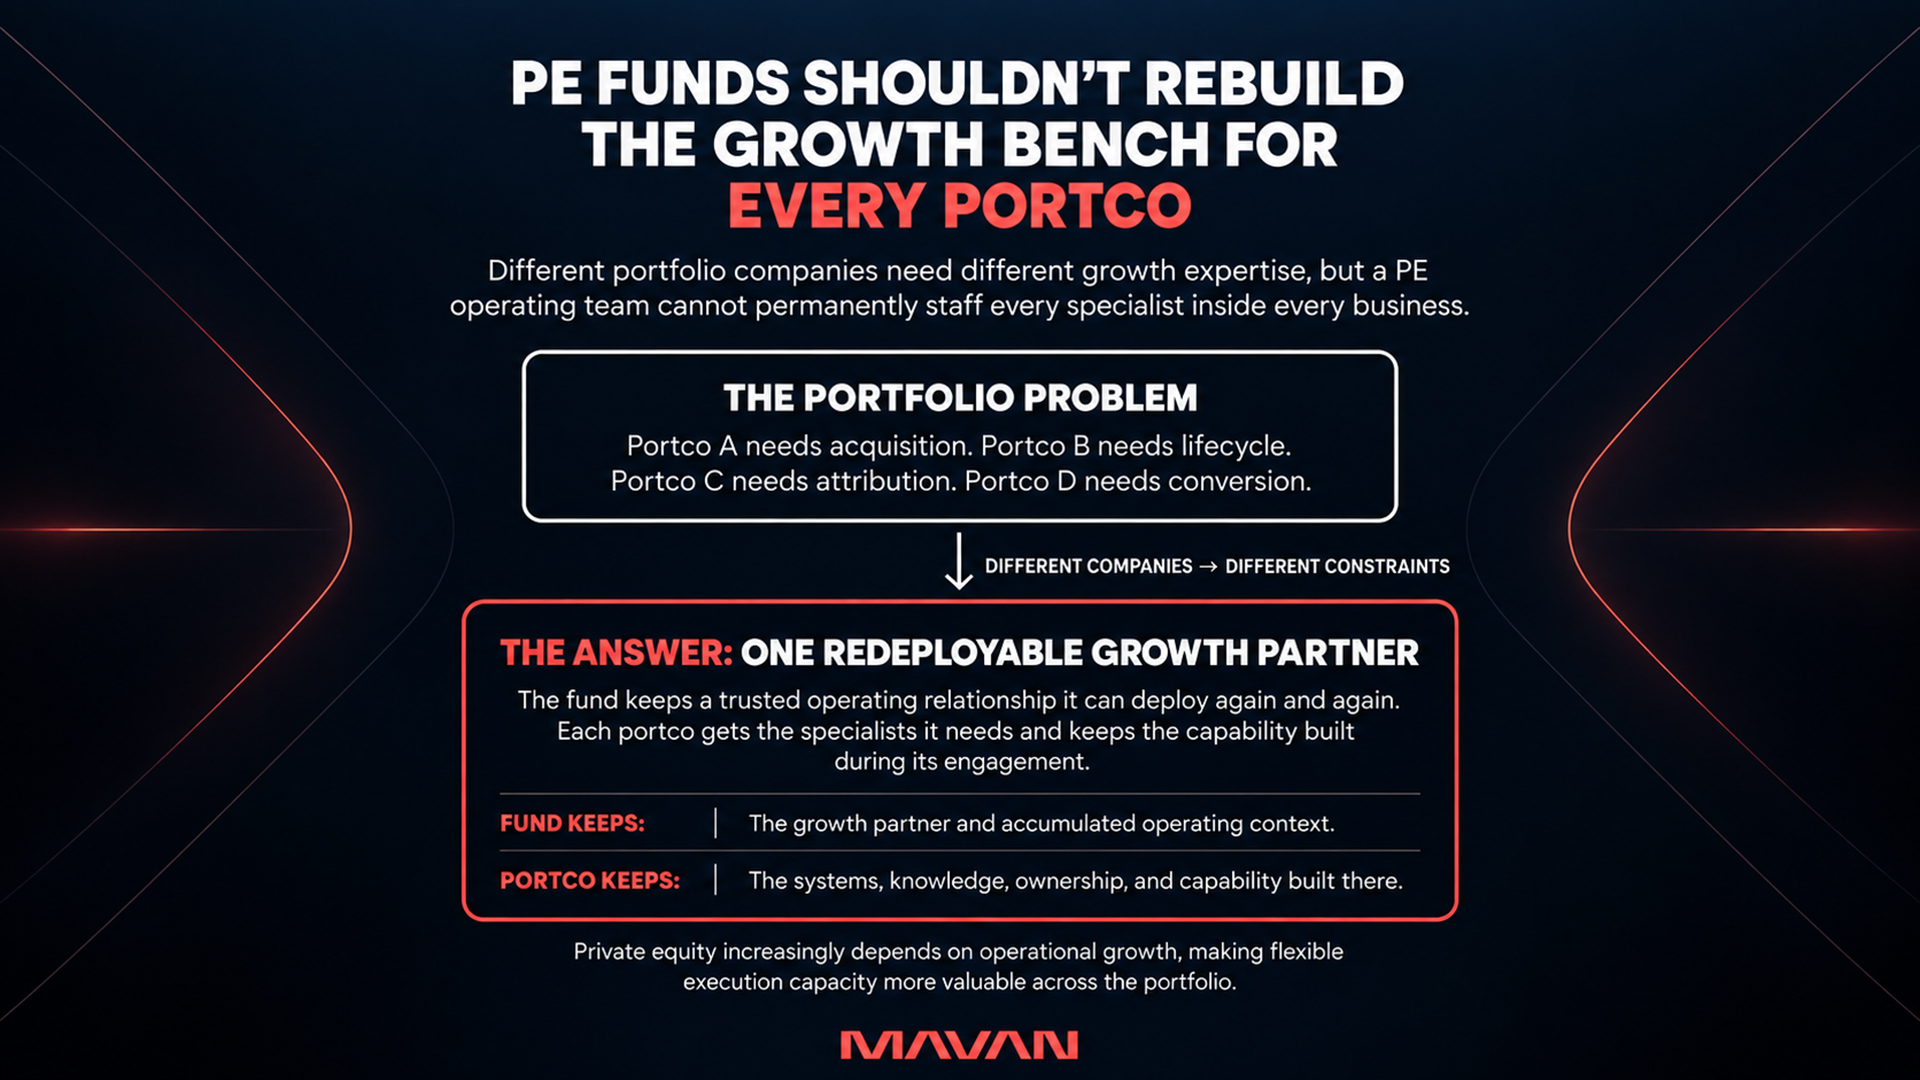
What Do PE Funds Want From a Portfolio Growth Partner? Repeatability!
What funds actually want from a portfolio growth partner is repeatability — a portable growth operating system that produces comparable results across very different portfolio companies. Repeatability shows up as a single source of truth, a board-grade scoreboard, a 90-day sprint, and a clean handoff, so each win compounds across the portfolio instead of staying at one company.
-
What’s the Best Growth Agency For VC & PE?
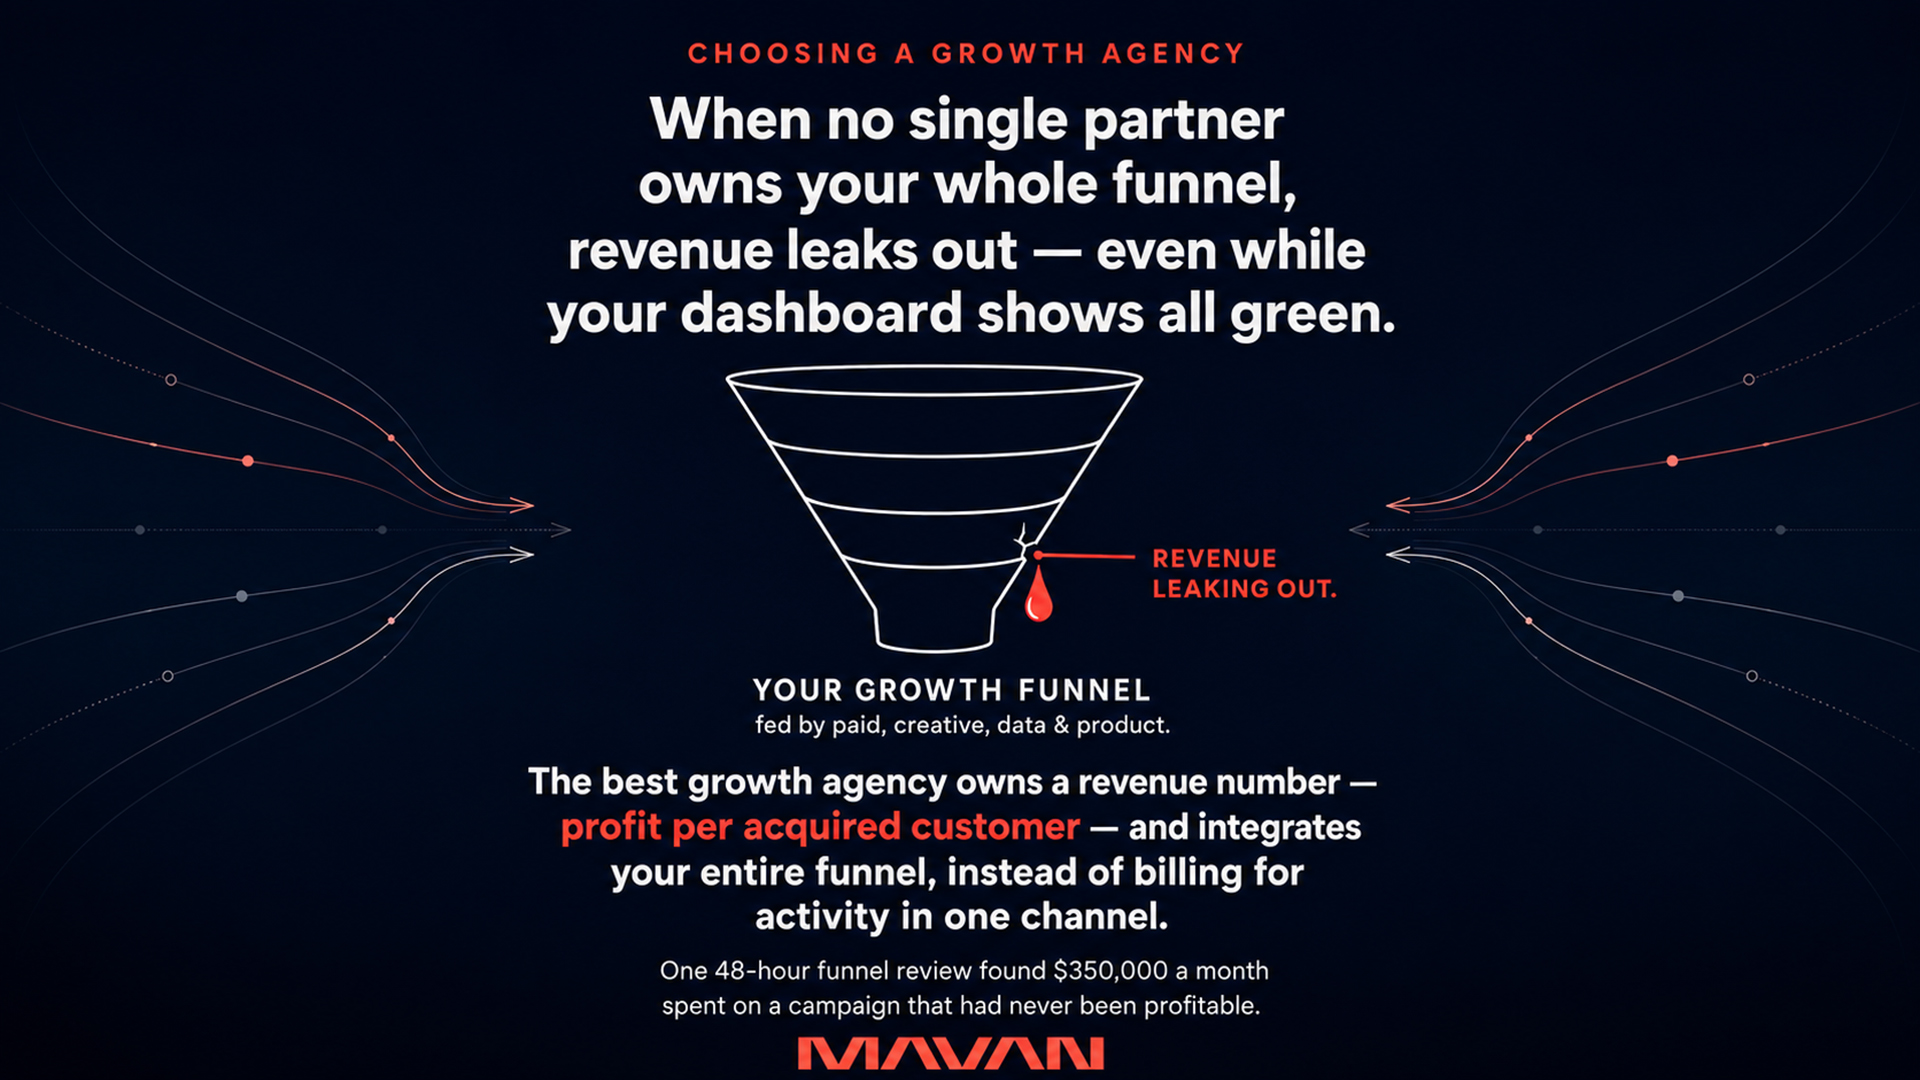
The best growth agency for a venture-backed or PE-owned company behaves less like a traditional agency and more like an embedded operating partner. It diagnoses your whole funnel, owns a revenue number such as CAC payback or LTV:CAC, and executes inside your team — rather than billing for activity in one channel.