
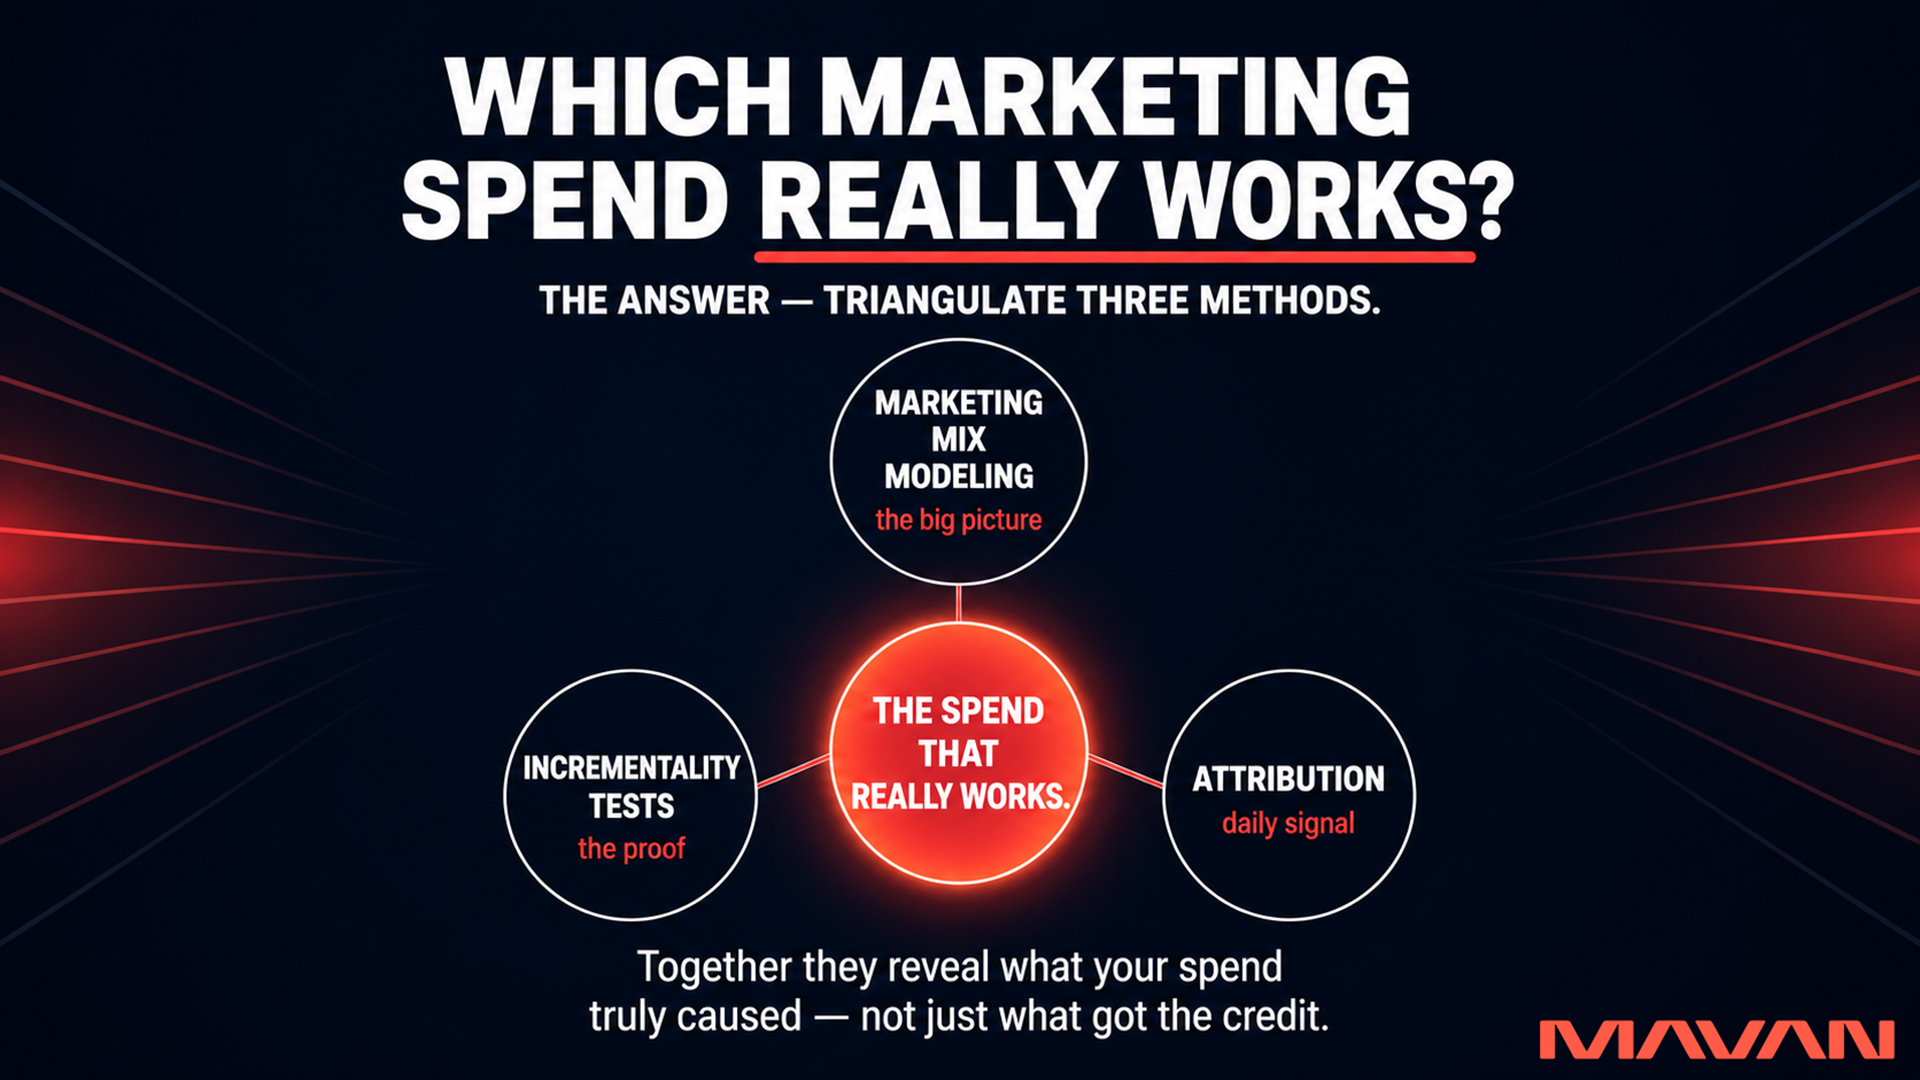
To know which marketing spend actually works, combine three methods — marketing mix modeling for the strategic portfolio view, incrementality tests for causal proof, and platform attribution for tactical signal — and run them through one source of truth your board can trust.
TLDR — How To Find Which Marketing Spend Really Works
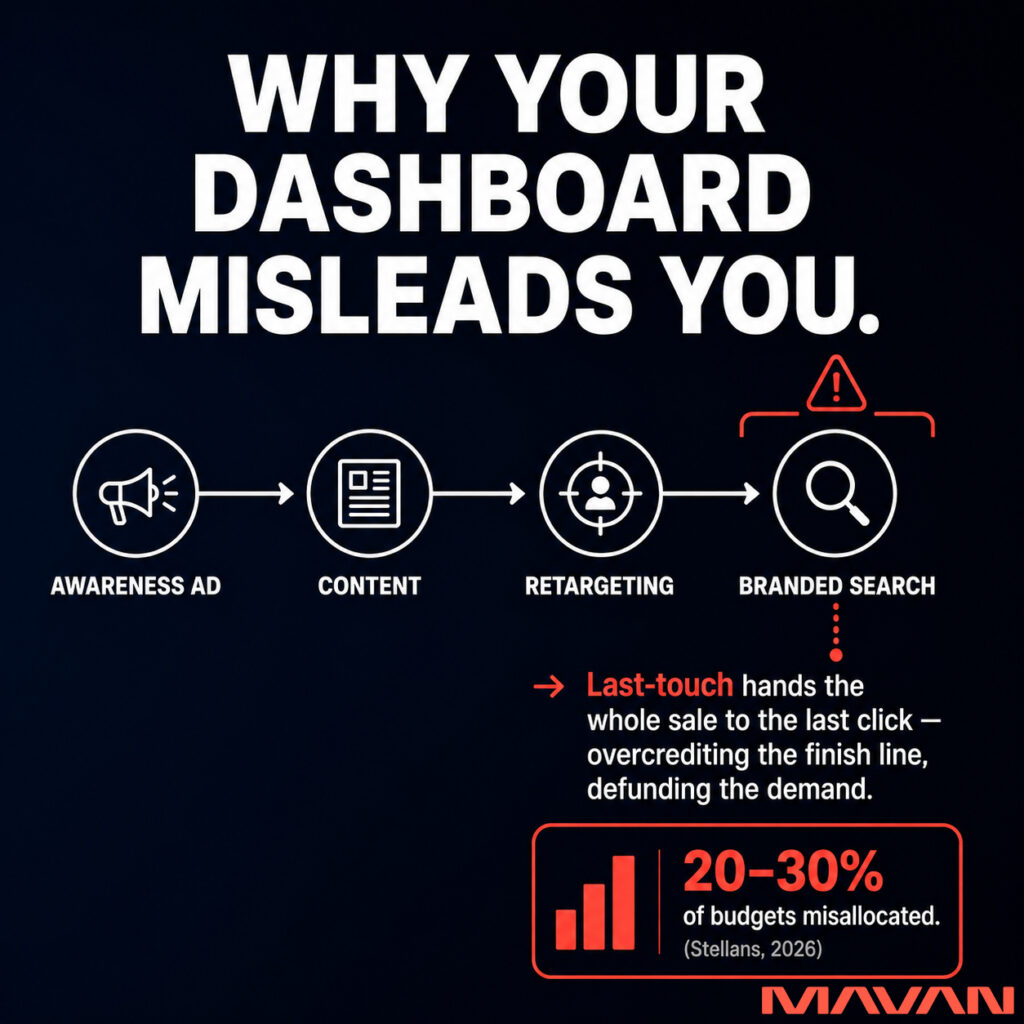
- Dashboards show which channel got credit — not which spend caused the sale.
- Last-touch overcredits branded search and retargeting, defunding the demand you built.
- Don’t trust platform ROAS alone — privacy loss made it a modeled guess.
- Use marketing mix modeling for the big picture: score each channel’s revenue impact.
- MMM alone is correlation — calibrate it with real experiments before you trust it.
- Prove cause with incrementality: turn a channel off and watch what revenue does.
- Run holdout tests on a rolling basis — quarterly, and after any platform change.
- Triangulate all three methods into one source of truth your board shares.
- Decide on marginal CAC (the next dollar); report on blended CAC (the whole machine).
- Want to find your real winners? Contact MAVAN today about a 360 Growth Analysis.
A growth lead opens her dashboard on Monday. Meta reports a 4x return. Search reports 3x. She shifts another $40,000 toward the channels the dashboard loves, trims the ones it ignores, and waits. Three weeks later, total revenue hasn’t moved. The dashboard was never lying to her. It was answering a different question than the one she needed answered.
She was asking which spend caused the sales. The dashboard told her which channel got credit for them. Those two questions look identical on a screen and diverge by millions in a budget. If you run paid acquisition at a venture-backed company — and the board now wants every dollar defended — the gap between credit and cause is the most expensive thing on your P&L that nobody put a line item against.
Platform-reported attribution tells you where a conversion was claimed, not what your spend actually caused — so to scale paid with confidence, you measure incrementally by combining marketing mix modeling, holdout tests, and one board-grade source of truth.
That’s the whole argument of this piece. The rest is how to put it to work this quarter.
Why Don’t My Marketing Dashboards Tell Me What’s Actually Working?
Your dashboards report attributed conversions — the ones a platform claims credit for after the fact. They can’t separate the customers who converted because of an ad from the ones who would have converted anyway. With privacy changes erasing user-level signal, that credit is now an estimate stacked on an estimate.
Two forces created the gap. The first is structural: most platforms grade their own homework. A last-touch model hands the entire sale to the final click before conversion, which systematically overcredits the channels sitting closest to the finish line — branded search, retargeting — and defunds the upper-funnel work that created the demand in the first place. Sam McLellan, VP of Growth at MAVAN, puts the limit plainly: “if you’re doing B2B, Last Touch is probably not ideal.” You want the full sequence of touches — the last click standing alone tells you almost nothing.
The second force is signal loss. Apple’s privacy changes and cookie deprecation hollowed out the user-level tracking the old models ran on. Eric Seufert, General Partner at Heracles Capital, described the new reality on our Growth at Scale podcast: there is now “less signal, less data to use … to make spending decisions, budget decisions, optimization decisions.” The platforms have backfilled that hole with statistical modeling — fingerprinting, probabilistic matching — which means the precise-looking number on your screen is increasingly a guess wearing a lab coat.
The cost is real budget pointed at the wrong place. Stellans estimates that 20–30% of marketing budgets are misallocated in 2026 under this signal loss, and Forrester predicts confidence in marketing measurement will keep declining this year. We see the same pattern in the field — a channel that reports a clean return often turns out to be claiming sales it never created. We’ve written more on the two ways this breaks in our piece on why B2B SaaS attribution breaks — and how to fix it.
What Is Marketing Mix Modeling — And Why Is It Back In 2026?
Marketing mix modeling (MMM) is a statistical method that compares your aggregate spend across every channel against your aggregate sales over time, then estimates how much each channel actually contributed. It needs no cookies, device IDs, or consent — only spend and outcomes — which makes it durable against privacy rules that broke user-level tracking.
MMM is not new. It dates to the 1960s and lived for decades inside large consumer-goods companies as a once-a-year strategic review. Two modern shifts brought it back. The first is the signal loss above: when you can’t follow individual users anymore, an aggregate model that never needed to follow them starts looking smart by comparison. The second is access. Meta open-sourced its MMM tool, Robyn, in 2023, and Google released its own, Meridian, in January 2025 — collapsing what used to be a seven-figure vendor engagement into a framework a capable data team can run.
Two pieces of jargon are worth translating, because they’re where MMM earns its keep. Adstock is just advertising memory — the idea that an ad someone saw last week can still drive a purchase this week, so spend doesn’t stop working the moment a campaign ends. Saturation is diminishing returns — the point where the next dollar into a channel buys less than the last one did. A good model finds that point for you, which is how MMM answers the question your CFO actually asks: Where does the next dollar do the most work?
One caution we repeat to every client considering it: MMM on its own measures correlation, not cause. A model can notice that sales rise whenever you spend on a channel without proving the spend caused the rise. That limitation is exactly why the next two layers exist — and why MMM alone is never the answer.
What’s The Difference Between Incrementality And Attribution?
Attribution assigns credit for a conversion that already happened. Incrementality measures what wouldn’t have happened without the spend. Attribution asks “who gets the sale?” Incrementality asks “did this spend create a sale that didn’t exist before, or just take credit for one that was coming anyway?” Only the second question protects your budget.
The cleanest way to run it is a holdout — you withhold a channel or a campaign from one comparable group while keeping it on for another, then measure the difference. The simplest version is the one we’ve long advocated: turn the spend off and watch what happens to revenue. We made the full case for it in our breakdown of the paused-spend test. If sales hold steady after you cut a channel, that channel was harvesting demand, not creating it — and the “return” on your dashboard was a mirage.
This is the discipline most growth teams skip because it feels like leaving money on the table. It isn’t. It’s the difference between a number you can defend and a number you can only hope is right. Dan Barnes, President of MAVAN, frames the board-level version of it directly. The honest answer to how do you know the attribution is real is that “you don’t rely on platform-reported attribution. You run holdout tests on a rolling basis and you show the board the last incrementality measurement and when you ran it.”
“You run holdout tests on a rolling basis and you show the board the last incrementality measurement and when you ran it.” — Dan Barnes, President, MAVAN
The word rolling matters. Channels decay, auctions shift, and a holdout you ran in January is stale by April. Incrementality isn’t a one-time audit. It’s continually taking the pulse of a living heart.
How Do You Combine MMM, Incrementality, And Attribution Into One System?
Use all three at different altitudes. Marketing mix modeling gives you the strategic, top-down view across every channel. Incrementality tests give you causal ground truth on specific channels. Platform attribution gives you fast, tactical signal for day-to-day optimization. You calibrate the model with the experiments, then sanity-check the platforms against both.
This layering is what the field now calls a triangulated framework, and it’s what Forrester recommends: campaign-level measurement and incrementality testing feeding into MMM, rather than any one method ruling alone. The logic is simple once you see the altitudes. MMM is the map — it shows the whole territory but updates slowly. Incrementality tests are the survey stakes — they tell you exactly where one boundary truly sits. Platform dashboards are the live traffic feed — fast, granular, and only as honest as the signal behind them. A map drawn without survey stakes is a guess; survey stakes without a map tell you about one corner of the property and nothing about the rest.
Here’s how the three methods divide the work:
| Method | The question it answers | Best used for |
|---|---|---|
| Marketing mix modeling | Across everything I spend, what’s working? | Strategic budget allocation across channels |
| Incrementality / holdout tests | Did this spend cause sales, or claim them? | Proving causation and calibrating the model |
| Platform attribution | What’s happening right now, by campaign? | Daily tactical optimization |
To build the system, run it in this order:
- Get to one source of truth first. Before any modeling, reconcile spend and revenue into a single warehouse that finance, product, and growth all read from. A model built on numbers three teams disagree about will produce three arguments, not one answer.
- Run your first holdout on your biggest claimed winner. Pick the channel your dashboard credits most and turn it off in a comparable market or audience. Measure the revenue difference. This is your cheapest, fastest read on whether your reported returns are real.
- Stand up MMM at the channel level, not the campaign level. Google is explicit that MMM is built for channel strategy, not campaign reporting — campaigns with hard start and stop dates corrupt the model’s read of advertising memory. Use it to allocate across channels, not to grade individual ads.
- Calibrate the model with the experiments. Feed your holdout results into the MMM so its estimates anchor to something you proved rather than something it merely noticed. A model calibrated this way stops being a correlation engine and starts approximating cause.
- Re-run holdouts on a schedule. Quarterly at minimum, and immediately after any major platform or pricing change. Each fresh experiment re-anchors the model to current reality.
How Do You Make Marketing Measurement Board-Grade?
Board-grade measurement means numbers that survive scrutiny in the room. That requires four things: one source of truth, the right CAC for the right decision, thresholds instead of targets, and a standing record of your last incrementality test. The goal isn’t a prettier dashboard — it’s ending the argument about whose number is correct before the meeting starts.
Start with the metric that does the most damage when it’s wrong: return on ad spend reported gross. It looks like performance and isn’t. As Dan Barnes puts it, “It feels like a performance metric but it’s a reporting artifact” — it ignores fees, returns, and incremental lift. He replaces it with contribution margin per acquired user at day 90, which is harder to calculate and, in his words, impossible to game.
Then separate your two CAC numbers, because boards conflate them constantly. “Marginal for decision-making, blended for reporting,” Barnes says. “Marginal tells you whether the next dollar is worth spending. Blended tells you how the overall machine is performing.” Marginal CAC — the cost of the next customer, not the average one — is the number that should drive whether you scale a channel. Sam McLellan goes further on what belongs inside that cost: for the LTV side of the ratio he keeps it “always going to be gross,” and on cost he argues for loading in everything you can — tools, people, the real price of running the business — so the ratio can’t flatter you. (We walk through that full calculation in our guide to improving your LTV:CAC ratio.)
The most underused signal on the scoreboard is the gap between forecast and actual. Barnes calls the difference between modeled ROAS and delivered ROAS “one of the most honest signals you have about whether your acquisition economics are working or degrading.” When that gap widens, your model is drifting from reality — and that’s your earliest warning, long before CAC visibly climbs.
Two design rules make the whole thing hold. First, set thresholds, not targets: “A threshold is operational — it tells you when to change behavior.” Red means stop and escalate today; yellow means flag it and have a plan by next week. Second, insist on a single source of truth, because the alternative rots accountability from the inside. Without it, Barnes warns, “everyone can always find a number that defends their position, which means no one is ever actually wrong, which means nothing changes.” The full version of this scoreboard — the twelve metrics and the thresholds behind them — lives in our board-ready scoreboard breakdown.
One risk this system surfaces that no single dashboard will: concentration. Most performance programs lean on one or two channels, and “when platform policy changes or auction dynamics shift, the entire growth model can reprice overnight,” Barnes notes. McLellan has watched it happen in real time — a platform expands its audience network and “suddenly your campaign would just go gangbusters overnight,” spending into traffic nobody vetted. Measuring incrementally is how you catch that repricing in a holdout instead of in a quarterly miss.
Does Better Measurement Actually Lower CAC? What The Results Show
Yes — when measurement improves, teams stop funding channels that only claimed credit and concentrate spend on what truly drives growth. Across our client work, sharpening attribution and adding incrementality measurement has cut customer acquisition costs by 46–60% and, in one case, tripled efficiency while scaling spend. Better measurement isn’t overhead. It’s the lever.
The pattern repeats because the mechanism is the same each time — find the spend that isn’t incremental, redirect it.
- With KidStrong, tightening creative and conversion measurement helped cut customer acquisition costs by 60%, a result their CMO Erin Clift attributed directly to the partnership.
- With Fireflies, moving to value-based optimization and disciplined geo expansion drove a 46% reduction in CAC quarter over quarter at more than $700K in monthly spend.
- With Titan, rebuilding the tracking infrastructure first — then scaling on it — produced a 3x reduction in CAC alongside 5x growth in paid volume, expanding into 20-plus markets at positive incremental ROI.
- ElevenLabs is the clearest example: before we scaled their search spend more than 1,000% at target return, we established improved attribution logic and incrementality measurement so scaling decisions rested on data the team had confidence in.
The through-line is that none of these started with a clever campaign. They started with measurement teams could trust. You don’t scale your way out of a measurement problem. You measure your way into a scaling opportunity.
The full set lives on our case studies page.
Frequently Asked Questions About Measuring Marketing Spend
Is marketing mix modeling worth it for a startup, or only for large enterprises?
It’s now worth it far earlier than it used to be. Open-source tools from Google and Meta removed the seven-figure price tag that once made MMM enterprise-only. The real prerequisite isn’t budget — it’s clean, reconciled data. If your spend and revenue still live in disagreeing dashboards, fix that before you model anything.
How is incrementality testing different from a standard A/B test?
An A/B test compares two versions of something — a landing page, a creative — to see which performs better. An incrementality test compares spending against not spending at all, to prove a channel creates sales rather than harvesting ones that were already coming. One optimizes a tactic; the other validates whether the spend should exist.
Can’t I just trust the ROAS my ad platforms report?
Treat it as one input, not the verdict. Platforms grade their own performance and, since privacy changes, increasingly model the conversions they can no longer track. Use platform numbers for fast daily optimization, then check them against holdout tests and a mix model before making budget decisions that matter.
How often should I run incrementality tests?
On a rolling basis — quarterly at a minimum, and immediately after any major platform policy change, pricing change, or new market launch. Channels decay and auction dynamics shift, so a test from two quarters ago no longer describes today. The point is a steady heartbeat of evidence, not a one-time audit.
What’s the single biggest measurement mistake growth teams make?
Optimizing toward cheap top-of-funnel numbers. As Sam McLellan notes, founders often chase sub-$5 — or even sub-$1 — installs as a sign of success, but cheap installs that never convert aren’t a win. Anchor on contribution and incremental revenue, not the lowest cost-per-click on the screen.
Do I need a data science team to do this?
To run open-source MMM yourself, yes — these tools assume in-house statistical capability. But you can start the highest-value work today without one: reconcile your data into a single source of truth and run your first holdout test. Many teams bring in an embedded partner to stand up the system, then run it internally once it’s proven.
Measure Cause, Not Credit To Ensure Effective Marketing Spend
Your dashboards measure where conversions were claimed, not which spend created them — and in a privacy-constrained 2026, that gap is widening, not closing. The fix is a triangulated system: marketing mix modeling for the strategic view across every channel, incrementality tests for causal proof, and platform attribution for tactical speed, all reconciled into one source of truth your board can read. Done well, this is what lets you scale paid spend with confidence instead of crossing your fingers — and it’s how teams turn a measurement problem into a 46–60% reduction in CAC. The teams that win the next budget cycle won’t be the ones with the prettiest dashboard. They’ll be the ones who can prove what their spend actually caused.

If you’re about to scale paid spend but can’t yet prove which channels are truly incremental, then start with one move this week: reconcile your spend and revenue into a single source of truth, and turn off your biggest claimed winner in one market to see what revenue actually does.
When you’re ready to build the full measurement system — MMM, incrementality, and a board-grade scoreboard working together — our 360 Growth Analysis maps exactly where your measurement is leaking and what to fix first. It’s a diagnostic, not a commitment: you walk away with a prioritized plan whether you run it in-house or with an embedded team. You can also see how we approach incrementality and MMM directly on our growth services page.
Reach out to us about setting up a growth audit for your company.
Casey Rock is Content Director at MAVAN, where he helps turn complex ideas into clear, strategic content that drives growth. With over 15 years of experience across content strategy, SEO, media, and digital marketing, Casey focuses on building content systems that connect audience insight, brand storytelling, and measurable business outcomes.
Book a complimentary consultation with one of our experts
to learn how MAVAN can help your business grow.
Want more growth insights?
Thank you! form is submitted
[hubspot type=”form” portal=”20951211″ id=”9c538ed2-fb12-45f1-a573-ad7953c058cc”]
Related Content
-
How Do I Measure Which Marketing Spend Really Works?
To know which marketing spend actually works, combine three methods — marketing mix modeling for the strategic portfolio view, incrementality tests for causal proof, and platform attribution for tactical signal — and run them through one source of truth your board can trust.
-
Why Is Creative The Biggest Acquisition Lever (And Does AI Fit)?
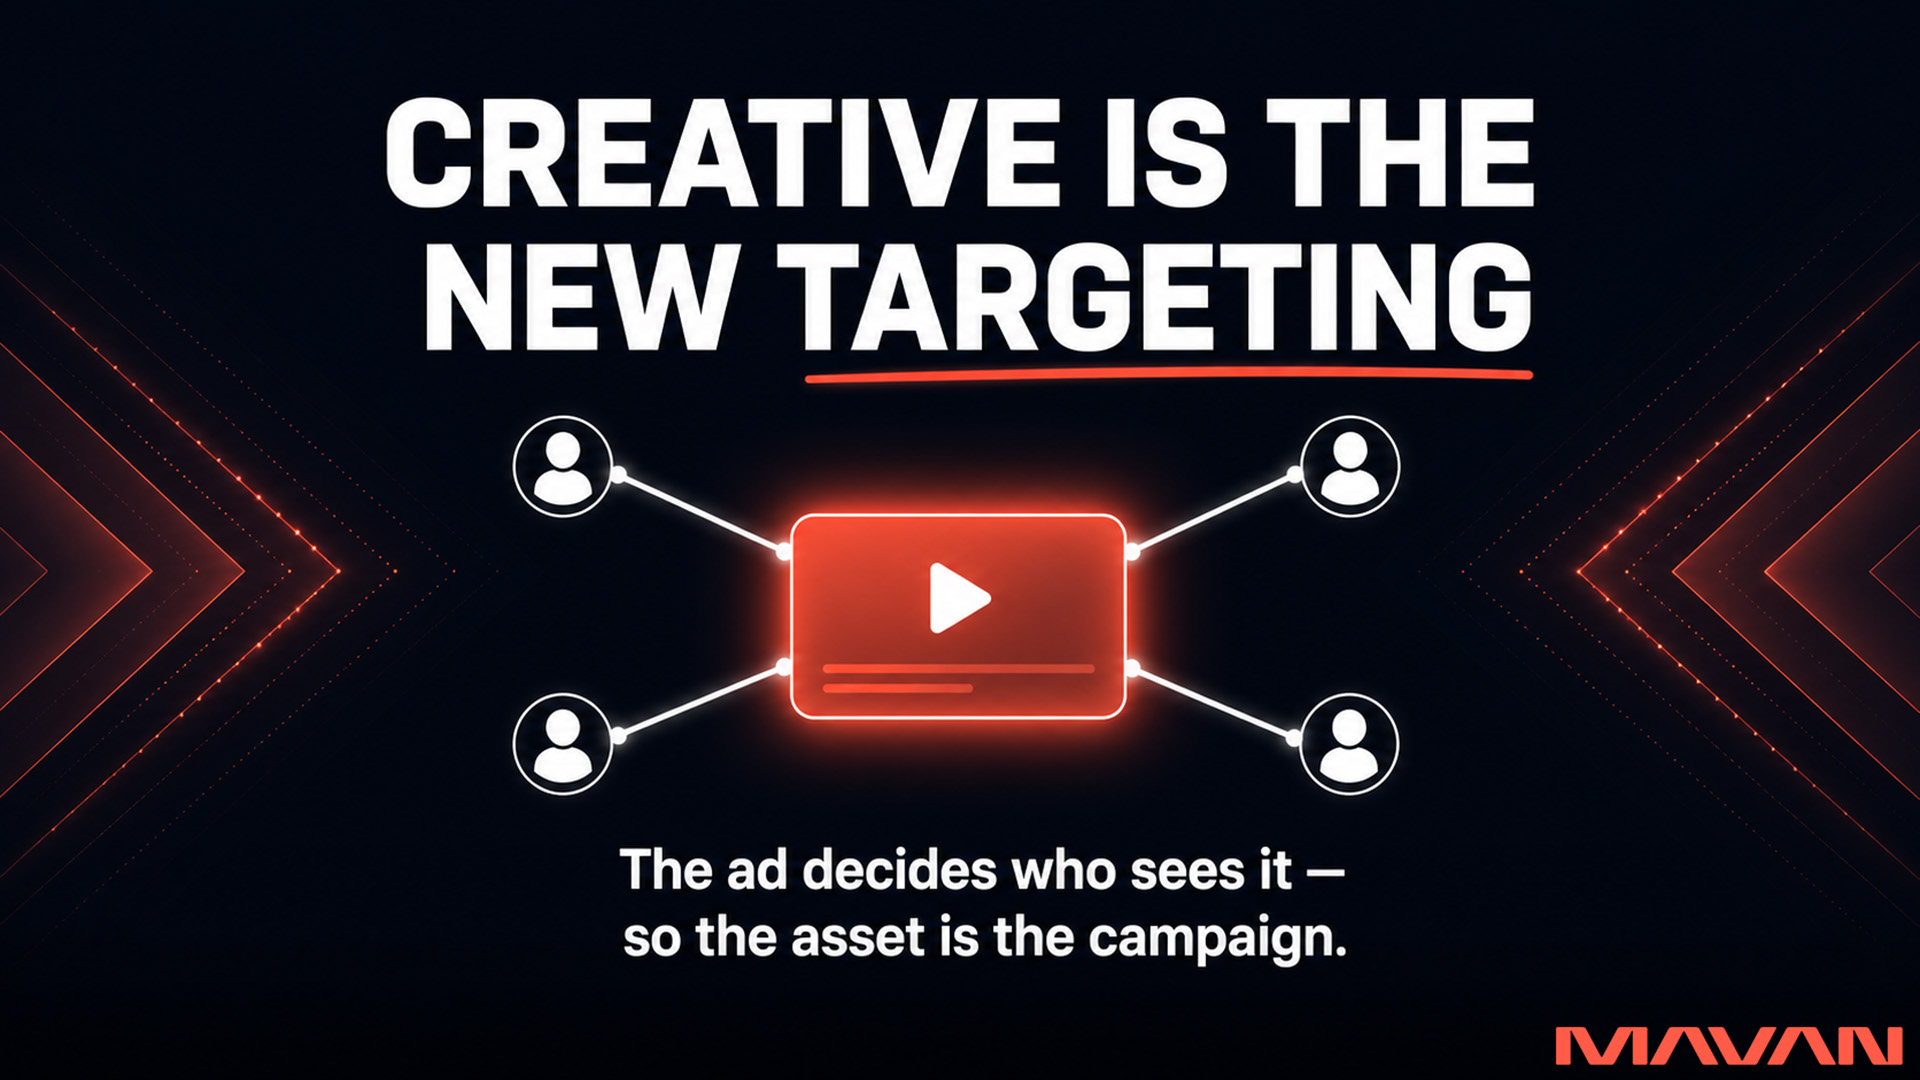
Creative has become the biggest lever in paid user acquisition because privacy changes erased most targeting signal, so platforms like Meta now read your ad itself to decide who sees it. The smartest use of AI is extending the life of proven creative — not generating new assets from scratch, which audiences and ad algorithms increasingly ignore.
-
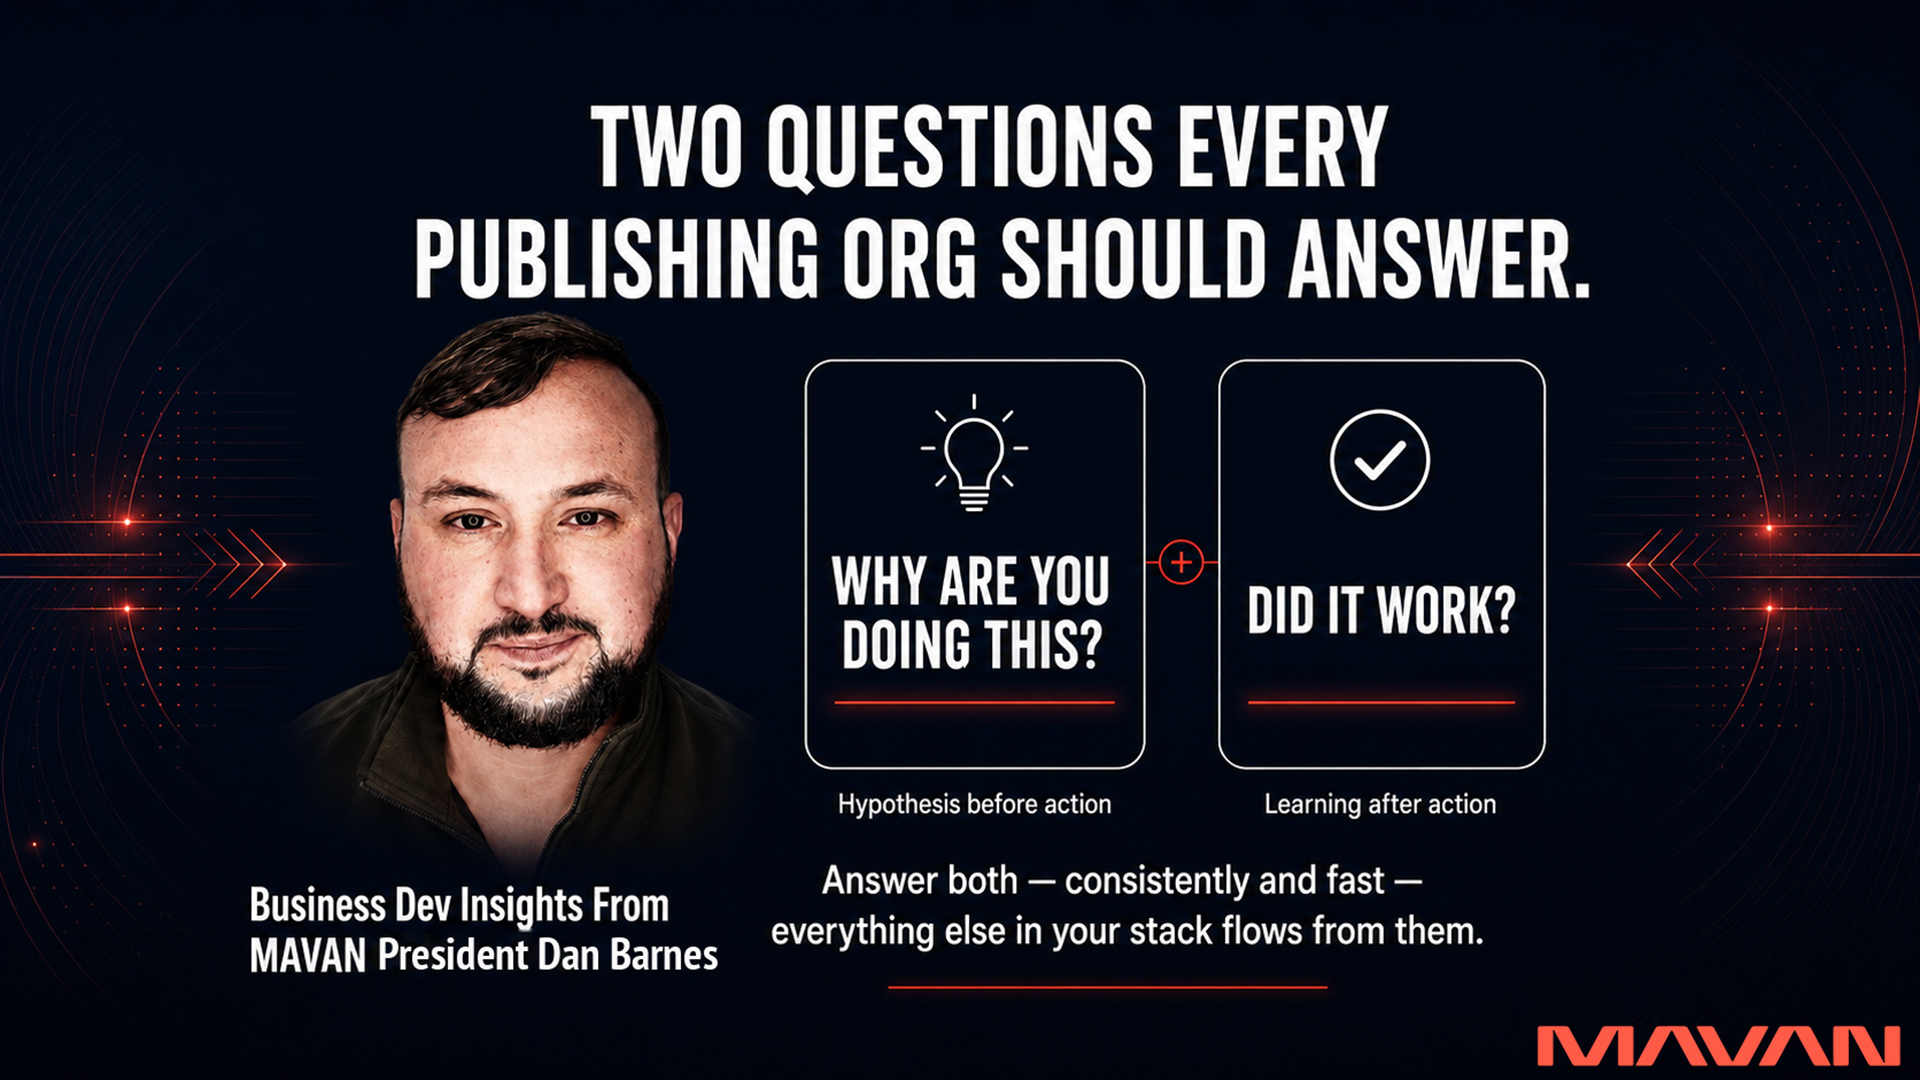
Two Growth Questions Publishing Orgs Should Be Able to Answer
Every publishing organization should be able to answer two questions: 1) “Why are you doing this?” 2) “Did it work?” Answering both requires a unified data platform, creative-led distribution, configurable onboarding, organic and lifecycle systems built on a deep audience graph — and an organization wired to turn insight into action fast.