
Incrementality testing measures the sales your marketing caused by comparing results with ads against results without them. It separates real lift from sales that would have happened anyway. Turning paid marketing off is one way to run it. You find your organic baseline, then add channels back one at a time to see what each truly drives.
TLDR — What Incrementality Testing Shows and How to Run It
- Incrementality is what your ads caused, not claimed.
- Ad platforms report credit. Only tests prove cause.
- Pausing all paid spend is one way to test it.
- A full pause reveals your true organic baseline.
- Add channels back one at a time at steady spend.
- Judge each test on total sales, not platform reports.
- Test the channel your dashboard loves most first.
- Brand search ads often buy clicks you’d get free.
- Cutting spend that adds nothing lifts EBITDA fast.
- See how MAVAN’s growth operators can help.
At the start of the pandemic in 2020, Airbnb pulled back all of its marketing as travel collapsed. Traffic came back anyway. “Before we started resuming our marketing spend, our traffic levels came back to 95% of the traffic levels of 2019 without any marketing spend,” CEO Brian Chesky told investors, CoStar reported. The company went on to cut its annual marketing budget from $1.14 billion to $482 million, according to Campaign.
Most companies never learn what Airbnb learned, because they never switch their ads off long enough to look. Their dashboards credit paid media with sales that may have arrived anyway. Incrementality testing closes that gap. It tells you what your marketing caused, rather than what it claimed.
This guide explains what incrementality testing is and why turning paid marketing off is one of the clearest ways to run it. We compare the main test methods, lay out a step-by-step paused spend plan, and show how to read the results. The final section covers what the answer means for EBITDA at PE-backed companies. (Our guide on how to measure which marketing spend really works covers marketing mix modeling and how it fits with testing.)
Key Terms to Know Before You Test
- Incrementality
- The share of your results that your marketing actually caused. These are sales that would not have happened without the ads.
- Incrementality Testing
- An experiment that compares results with ads against results without them. The gap between the two is the lift your ads created.
- Organic Baseline
- The sales, sign-ups, or installs you get with no paid ads running. They come from search results, word of mouth, your brand, and repeat buyers.
- Control Group (or Holdout)
- The people, places, or time periods that don’t see your ads during a test. They show what would have happened anyway.
- Lift
- The extra results your ads produced compared with the control group. Lift tells you whether spend earned its keep.
- Attribution
- The rules a platform or tool uses to hand credit for a sale to an ad. Attribution assigns credit. It doesn’t prove cause.
- Paused Spend Approach
- A test where you turn off all paid marketing for a set period. You then add channels back one at a time and measure each one against your organic baseline.
What Is Incrementality Testing?
Incrementality testing is a controlled experiment that measures the sales, sign-ups, or installs your marketing actually caused. It compares a group that sees your ads with a matched group that doesn’t. The difference is your lift. Pausing all paid spend is one method. Holdouts, geo tests, and platform lift studies are others.
Every test asks the same question: what would have happened without the ads? A shopper who searches your brand name and clicks your ad might have clicked the free listing right below it. Someone who installs your app after a retargeting ad may have been on the way already. Attribution tools give the ad credit in both cases. An incrementality test checks whether the ad changed anything at all.
Why Do Dashboards Overstate What Ads Do?
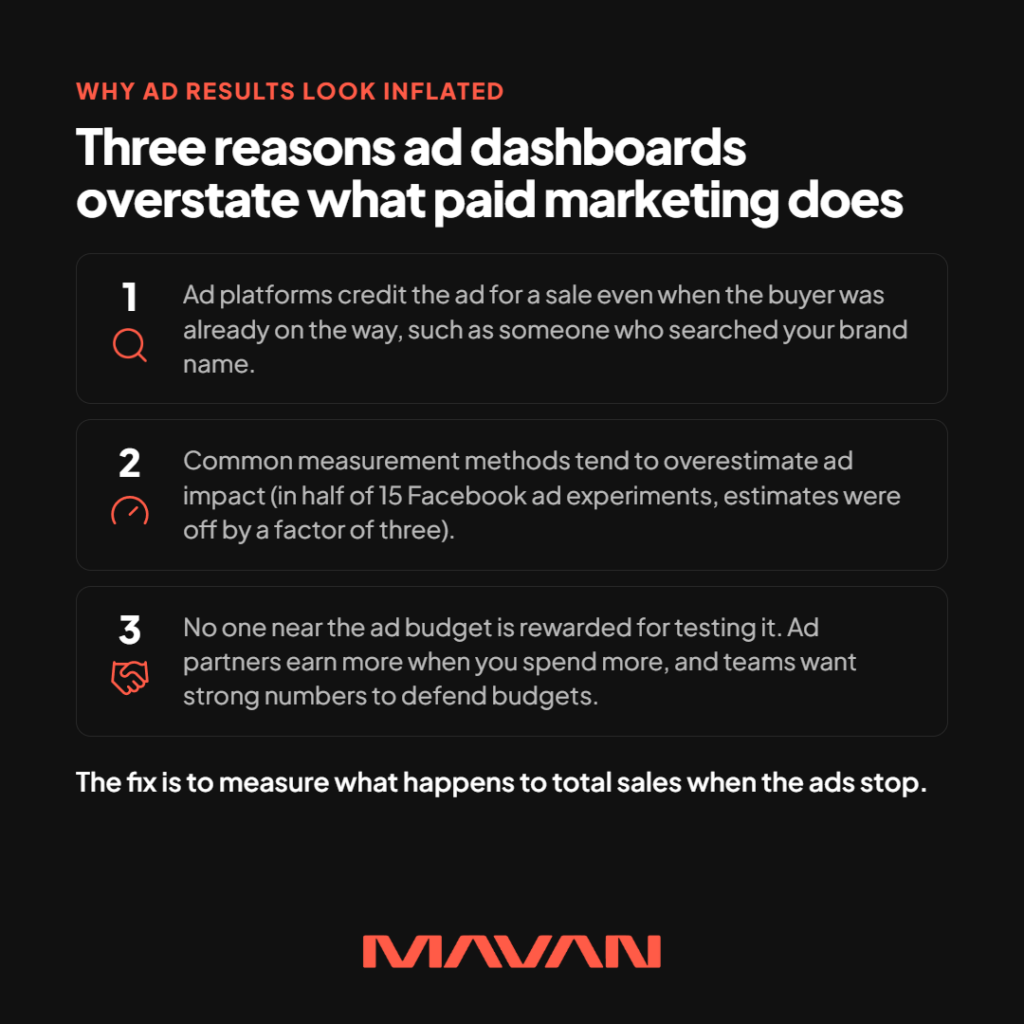
The gap between credit and cause runs wide. Researchers from Northwestern University and Facebook compared 15 large Facebook ad experiments against the observational methods advertisers commonly use instead. Those common methods generally overestimated how well the ads worked, INFORMS announced when the study appeared in Marketing Science. In half the studies, the estimates missed by a factor of three, the Marketing Science Institute summarized.
That’s why we treat experiments as ground truth and platform numbers as a fast, rough signal. Dan Barnes, MAVAN’s President, boils every board debate about paid media down to two questions.
“Underneath all the specific questions about paid, there are really only two that matter: why are we doing this, and how do we know if it worked.” — Dan Barnes, President, MAVAN
Incrementality testing answers the second one, and more teams now run it. Just over half (52%) of US brand and agency marketers use incrementality tests and experiments to measure campaigns, according to a July 2025 EMARKETER and TransUnion survey. Google also cut the minimum budget for its incrementality tests from about $100,000 to $5,000, Search Engine Land reported. Testing is no longer reserved for the biggest spenders.
Why Should You Turn Paid Marketing Off to Test It?
Turning paid marketing off shows you what your business does on its own. That organic baseline becomes the yardstick for every paid dollar. Without it, ad platforms and internal teams can claim sales that would have come anyway. A full pause cuts through those claims, removes vendor bias from the test, and adds no new media cost.
Think of it as an elimination diet for your marketing. You remove everything, see how the body behaves, then add items back one at a time. Each return shows you what that item does. Most advertisers never try it, because it feels like leaving money on the table. The evidence suggests the table often holds less money than the dashboard shows.
What Happens When Big Advertisers Switch Ads Off?
eBay’s own economists ran one of the best-known tests. They stopped buying search ads on queries that included the word “eBay.” “We found that when you turn off the paid advertising, almost all of the traffic that came through the paid search is just substituted by the other free channels,” Steven Tadelis, one of the researchers, told UC Berkeley’s Haas School. The team then switched off paid search in 68 US regions for 60 days. Its paper in Econometrica found that returns from paid search were a fraction of what standard estimates showed.
Not every pause ends that way. When the car research site Edmunds shut off its paid brand search in test markets, it lost about 72% of that traffic, economists wrote for VoxEU. Brand strength, competitors, and buying habits all change the answer. That’s exactly why we test rather than assume.
Sometimes the missing piece is fraud. Matt Widdoes, MAVAN’s Founder and CEO, once put together a task force to review a full year of users from paid ads at a fast-growing company. The team found over $25M a year flowing to ad networks that were “claiming organic users” as their own. No dashboard flagged it. It took a fresh review of a year of data to find.
Why Do So Few Teams Run This Test?
Everyone near your ad budget has a reason not to ask. Ad partners earn more when you spend more. Marketing teams want strong numbers to defend their budgets. Finance often expects allocated budgets to be spent. None of these people act in bad faith, yet nobody in the chain gets rewarded for proving that spend did nothing.
Mobile app marketing learned this the hard way. In the early days of install campaigns, teams were judged on install volume and cost. Fraudsters noticed and faked installs at scale. On paper, the results looked great, so few people dug deeper. A paused spend test removes those incentives. No vendor designs the test, and no platform grades its own work. Your team owns the setup, the data, and the verdict.
What Are the Main Ways to Test Incrementality?
The main ways to test incrementality are user holdouts, PSA tests, ghost ad lift studies, geo holdouts, on/off time tests, and full paused spend tests. They differ in cost, precision, and scope. Platform tools measure one channel at a time. Geo tests and paused spend measure your whole business, which is the view a board needs.
Each method builds a control group in a different way. Here is how they compare.
| Method | How It Works | Main Trade-Off |
| User holdout (intent-to-treat) | A random slice of your audience is blocked from your ads, and you compare everyone in each group. | Free and simple, but noisy, since many people in both groups never would have seen an ad. |
| PSA test | The control group sees a charity ad (a public service announcement) in your ad’s place. | You pay for the charity ads, and platforms may show them to different people than your real ads. |
| Ghost ads (platform lift study) | The platform logs when it would have shown your ad to a control user, then compares buyers in each group. | Cheaper and more precise, but it covers one platform at a time and runs on that platform’s data. |
| Geo holdout | You turn ads off in some matched cities or regions and keep them on in others. | Works without user tracking, but needs enough regions and sales volume to read clearly. |
| On/off time test | You switch a campaign on and off across set days or weeks and compare the periods. | Easy to run, but delayed ad effects and weekly swings can blur the result. |
| Paused spend | You turn off all paid media, measure the baseline, then add channels back one by one. | Covers every channel at once, but you give up any real paid sales during the pause. |
Ghost ads came from economists Garrett Johnson, Randall Lewis, and Elmar Nubbemeyer. Their 2017 paper in the Journal of Marketing Research pitched the method as a cheaper, more precise option than PSA and intent-to-treat tests. Several ad platforms now offer ghost ad methods, the American Marketing Association noted when it honored the paper in 2022.
Small tests carry a catch, though. Lewis and economist Justin Rao studied 25 large ad experiments with major US retailers and brokerages, most reaching millions of customers. The median confidence interval on return on investment ran more than 100 percentage points wide, they reported in The Quarterly Journal of Economics. In plain terms, a small test often can’t tell a good campaign from a bad one. A full pause helps here. Switching off every channel creates a much bigger change than trimming one ad set, so the effect is easier to see.
How Is the Paused Spend Approach Different?
The paused spend approach withholds ads from everyone, rather than a slice of users. Your own team runs it, so no ad partner designs or grades the test. It follows a fixed order: one shared set of numbers, a written decision rule, a full pause, a baseline read, and a slow return, one channel at a time.

What Are the Steps of a Paused Spend Test?
Here is the sequence we follow. Each step depends on the one before it.
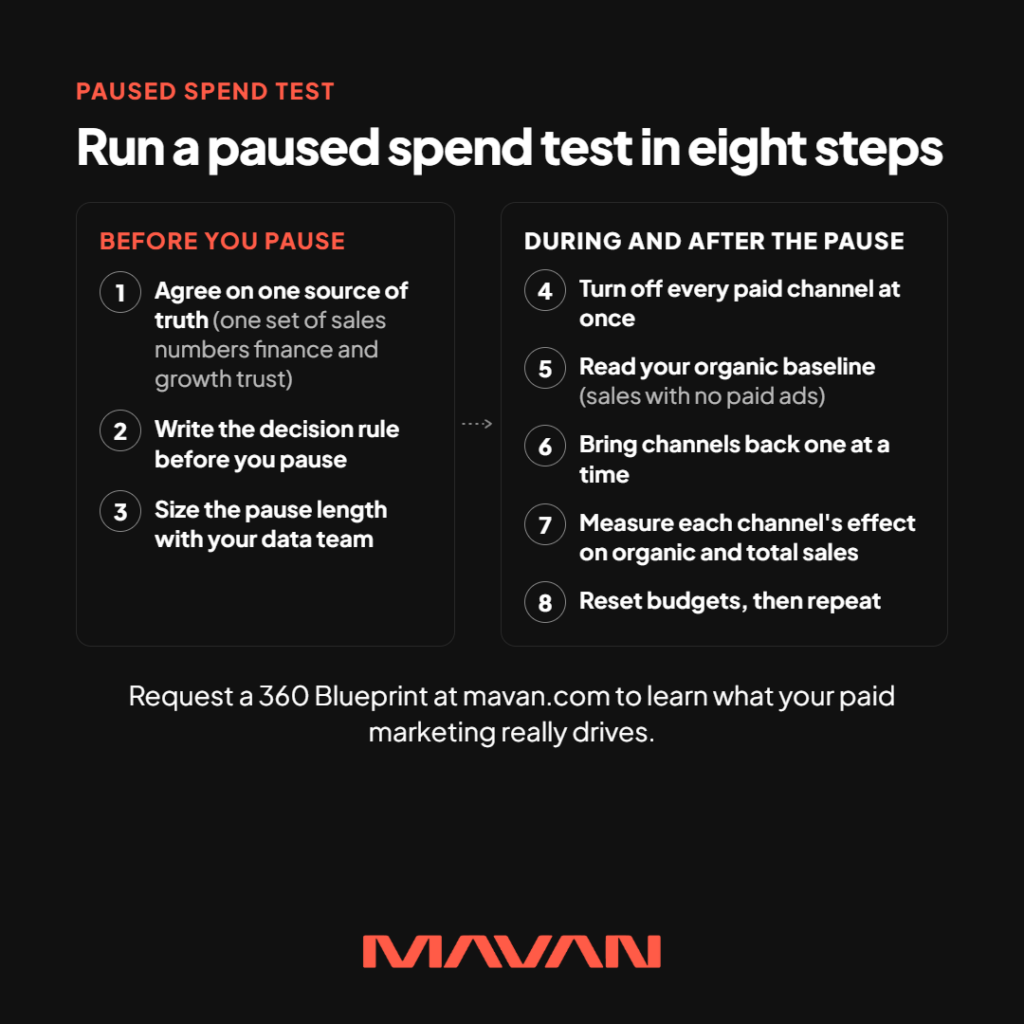
Before You Pause
- Agree on one source of truth. Pull spend, orders, and revenue into one data warehouse that finance and growth both trust. During a pause, platform dashboards go quiet or keep claiming credit, so they can’t serve as your scoreboard.
- Write the decision rule before you pause. Name the metric you will judge, such as first orders, paid sign-ups, or contribution margin (revenue minus the direct costs of earning it). Set the drop that would justify restarting a channel, and name who decides. Rules set in advance stop anyone from moving the goalposts later.
- Size the calm period with your data team. The pause must outlast your buying cycle. If customers often buy two weeks after seeing an ad, a one-week pause will mislead you. Gather several weeks of normal data first, and avoid peak seasons and big launches.
During and After the Pause
- Turn off every paid channel at once. This is where paused spend differs most from other tests. A holdout hides ads from a slice of people. The pause hides them from everyone, across every channel, operating system, and country in scope.
- Read your organic baseline. Track total results by day and by cohort: orders, revenue, sign-ups, and installs. Compare them with your pre-pause trend and the same weeks last year. What holds steady is demand your business creates without paid help.
- Bring channels back one at a time. Restart a single channel, operating system, or country at a steady budget. Keep spend flat during each phase so the read stays clean. Give each channel enough time to show its full effect before you add the next.
- Measure two things for every channel. First, check what happened to organic results. Did they hold, rise, or fall? Second, check whether total results rose by about what the platform claims. For example, if a channel reports 1,000 sales but totals rise by 300, about 30% of its claimed results are incremental.
- Reset budgets, then repeat. Fund channels in order of incremental return, and cut what added nothing. Then put the next test on the calendar, because channels, auctions, and competitors keep changing.
Who Is the Paused Spend Approach Right For?
This approach asks a lot of a team. It takes patience, strong analysts, and confidence in your data pipelines and attribution windows (the time limits for crediting an ad). The method also lacks a live control group, so seasonality or a news event can blur the read. Comparing against last year’s same weeks helps. We recommend it most for teams that have tried platform lift studies and hit their limits.
How Do You Test Paid Marketing Effectiveness Without a Full Pause?
To test paid marketing efficacy without a full pause, test in pieces. Start with the channel your dashboard credits most, then brand search, then retargeting. Use geo holdouts if you sell across many regions, and platform lift studies inside single channels. Judge every test on total business results and the cost of each incremental customer.
A full pause isn’t right for every company or every quarter. Smaller tests are the safer choice in a few common cases:
- Paid drives most new customers. If a long dip would strain cash, test one channel or one market at a time instead.
- A peak season or launch is near. Pausing then would cost more than usual, and the noise would muddy the result.
- You run a marketplace. Cutting demand in one city can throw diners, couriers, and restaurants out of balance.
Where Should Your First Test Go?
Start where the biggest claim sits. The channel your dashboard loves most often has the largest gap between credit and cause, and it carries the most budget. Brand search comes next, since eBay and Edmunds show the answer can swing either way. Retargeting follows, because it often reaches people who were already close to buying. Awareness campaigns come last. Their effects show up slowly, so they need longer tests.
Small, well-run tests also build trust inside a company. Jason Parmar, who works on ads and Quests at Discord and sits on MAVAN’s Advisory Group, described the pitch to Matt Widdoes. He asks people to name their biggest concerns and promises to be open about them up front. Then he asks for a small group to test on: “if you let me test and have free will over this small cohort, I can show you something.”
Which Mistakes Ruin a Test?
Most failed tests break in predictable ways. The first is ending too soon. Ads keep working after they stop, since people remember what they saw, so early numbers flatter the pause. The second is changing other things mid-test, such as pricing, promotions, or the product. Any of those can swamp the effect you’re trying to see.
The third mistake is ignoring competitors. Pause your brand search ads and a rival may start bidding on your name, which changes the result. The fourth is grading the test with platform reports. They measure their own channel, not your business. Use your warehouse numbers every time.
How Do You Read the Results of an Incrementality Test?
Read results in total business terms. If sales hold when ads stop, that spend was capturing demand you already had. When sales fall by about what platforms claimed, the spend is earning its keep. Then price each channel by the cost of an incremental customer, and fund the channels that clear your threshold.
Most results land in one of three places:
- Totals barely move. The channel was mostly harvesting existing demand. Shrink it, move the money, and retest later.
- Totals fall, but by less than claimed. The channel works in part. Use the gap to correct its attribution and re-price it.
- Totals fall by more than claimed. The channel also lifts organic demand. Its attribution undersells it, so it may deserve more budget.
How Do You Turn Lift Into Dollars?
Next, turn lift into money. Divide each channel’s spend by the customers it truly added. That gives you incremental customer acquisition cost (CAC), the real price of each new customer. Compare it with what those customers are worth over time, and use the cost of your next customer, not your average one, for budget calls. Our guide to fully loaded, blended, and paid CAC explains which number answers which question.
Treat every result as dated, because channels change.
“Just because it worked a year ago or didn’t work a year ago, does not mean it won’t work now.” — Matt Widdoes, Founder and CEO, MAVAN
A channel that failed last spring may work after a creative refresh. A channel that worked may decay as the auction fills with rivals. Record each test, its date, and its result, and keep the record in front of leadership. Our board-ready scoreboard shows how to keep those numbers simple enough to act on.
What Does Incrementality Testing Mean for PE Sponsors and Portfolio Companies?
For PE sponsors, incrementality testing turns marketing from a cost line into evidence. Cutting spend that drives nothing lifts EBITDA right away. Proving that the rest drives real revenue strengthens the growth case at exit. It also gives operating partners one method they can repeat across every portfolio company.
The math in PE has tightened. Typical deals now need about 10% to 12% average annual EBITDA growth to earn a 2.5x return over five years, Bain & Company found in its 2026 Global Private Equity Report. Marketing budgets, meanwhile, sit flat at 7.8% of company revenue, according to Gartner’s 2026 CMO Spend Survey. The same survey found 56% of CMOs lack the budget to deliver their 2026 strategy.
That combination makes incrementality a margin lever and a growth lever at once. Spend that adds nothing can come out of the budget fast, and the saving drops straight to EBITDA. Meanwhile, proven spend can scale with confidence. At exit, a buyer will ask how much revenue depends on paid media and whether it’s real. A measured organic baseline and a dated record of tests answer both questions. Operating partners can then run the same test design at the next portco, so the learning compounds across the fund.
How Does MAVAN Run Incrementality Testing?
We’re a growth operating company. We diagnose what will move the business, embed the operators needed to do the work, and leave the company with stronger systems. Every engagement starts with a 360 Blueprint: 28 days, five or more MAVAN specialists, and full access to the company’s platforms, people, and data. One of the blueprint’s findings themes covers data and infrastructure. That means what the numbers say, whether they agree, and what the ad platforms are actually being told. Every finding is evidenced.
NEXUS, our human-augmented paid media analytics platform, connects the ad platforms, the mobile measurement partner, and the warehouse into one view of acquisition performance. NEXUS is included with the 360 Blueprint. From there, operators drawn from our network of 170+ specialists design and run tests inside the company’s tools and meetings. They document the system, so the internal team can run it after we leave.
What Results Has This Approach Produced?
Measurement comes before scale in our work. For ElevenLabs, we took paid search from a test to a high six-figure monthly budget. Payback moved from 15 → 9 months against a board target of 12, and the program delivered positive incremental ROI across 20+ markets. Then it moved in-house. For CrossFit, we had 60 days to lift registrations for its annual competition. We ran a baseline lift analysis to check incrementality, hit the registration goal, and kept LTV:CAC above 3.0. Titan needed tracking it could trust before it could grow. We rebuilt it first, then scaled. CAC efficiency improved 3x while paid acquisition volume grew 5x. More results live on our case studies page.
Frequently Asked Questions About Incrementality Testing
These are the follow-up questions we hear most from growth leaders, portco executives, and operating partners. They cover how long to pause, how much risk to take, what to do about brand search, how much budget a test needs, and how testing fits with attribution and mix models. Each answer stands on its own.
How Long Should You Turn Off Paid Marketing?
There’s no single right length. The pause should outlast the usual gap between seeing an ad and buying, and it should cover full weekly cycles. Set the length with your data team before you start, based on your own sales history. Then hold to it, even if the early numbers look good.
Will Turning Off Ads Hurt Your Sales?
It might, and that’s the point of measuring. You limit the risk by pausing outside peak season, writing a stop rule in advance, and starting with one market or channel if paid drives most new customers. Airbnb and eBay lost little when they paused. Edmunds lost a lot.
Should You Stop Paying for Brand Search Ads?
Test before you decide. eBay found its brand ads added almost nothing, while Edmunds lost most of that traffic without them. Competition may explain part of the gap. If rivals bid on your name, your brand ads may protect sales you’d otherwise lose.
How Much Budget Do You Need for an Incrementality Test?
Platform tests have become cheap. Google now runs incrementality tests from a $5,000 minimum. Small tests still produce wide error ranges, though, so match the test to the decision. A paused spend test uses your existing budget and saves media cost while it runs.
Does Incrementality Testing Replace Attribution or Mix Modeling?
No. Attribution gives fast daily signal, and marketing mix modeling gives the big-picture budget view. Incrementality tests check both against reality. Our guide on measuring which marketing spend really works shows how the three fit together.
Where Should You Start With Incrementality Testing?
Start by agreeing on one set of numbers, then test the channel your dashboard credits most. Write your decision rule first, pause long enough to see the truth, and add spend back one channel at a time. Fund what your marketing causes, and stop paying for what it only claims.
Most companies we meet don’t lack ad data. They lack an answer they trust about which spend grows the business. That’s the gap a 360 Blueprint closes. In four weeks, our team works inside your platforms, people, and data. We check whether your numbers agree, where paid spend may be claiming sales it didn’t create, and which tests to run first. You leave with evidenced findings and a roadmap sorted by who has to move each action. Your team can run it on its own, or with MAVAN’s operators alongside.
Request a 360 Blueprint to learn what your paid marketing really drives.
Casey Rock is Content Director at MAVAN, where he helps turn complex ideas into clear, strategic content that drives growth. With over 15 years of experience across content strategy, SEO, media, and digital marketing, Casey focuses on building content systems that connect audience insight, brand storytelling, and measurable business outcomes.
Book a complimentary consultation with one of our experts
to learn how MAVAN can help your business grow.
Want more growth insights?
[hubspot type=”form” portal=”20951211″ id=”9c538ed2-fb12-45f1-a573-ad7953c058cc”]
Related Content
-
When Should a B2B SaaS Startup Hire a Growth Leader (What Kind of CMO)?
Mobile gaming teams have operated with granular attribution, segmented CAC, and whale-tier bidding for over a decade. B2B SaaS companies adopting the same three disciplines see clearer unit economics, faster optimization, and fewer wasted first growth hires.
-
Who Does Due Diligence for Private Equity Deals?
Strategy consultancies and boutique firms run commercial due diligence on the market. Operations advisors and PE operating teams run operational due diligence on how the company works. Growth and GTM due diligence falls to specialist diligence firms, GTM boutiques, and growth operating companies like MAVAN, which test the revenue engine from inside and can stay to run the fix.
-
How Do Private Equity Operating Partners Drive Value Creation?
Private equity operating partners drive value creation by turning the investment thesis into operating work inside each portfolio company. They set priorities, fix leadership gaps, and track the numbers that matter at exit. Because most now cover five or more companies, the best results come when they add outside execution capacity, especially for revenue growth.