
Private Equity funds repeat growth by standardizing the operating layer, not the tactics. Use shared definitions and evidence standards, redeploy one accountable cross-functional growth team from portco to portco, diagnose each company fresh, hand mature capabilities to its internal team, and carry the learning into the next deployment.
TLDR — Portfolio Growth Playbooks For PE Funds
- Repeat the operating discipline, not the last portco’s tactics.
- Keep one trusted growth partner deployable across the portfolio.
- Give every portco a fresh diagnosis before choosing the solution.
- Standardize metric definitions, evidence rules, ownership, and reporting.
- Keep channels, targets, tools, and specialist mixes company-specific.
- Prioritize portcos by value-creation upside and execution readiness.
- Embed one cross-functional pod behind one accountable lead.
- Execute against the real constraint and measure business impact.
- Hand mature capability to the portco before redeploying the partner.
- Carry learning forward so each deployment starts smarter, not identical.
- Explore our growth services or start with a 360° Growth Analysis.
The third portfolio company should not feel like day one of a brand-new consulting relationship.
Yet portfolio growth often gets bought exactly that way. One company hires a paid agency. Another brings in a lifecycle specialist. A third asks its CMO to stitch data, creative, product, and acquisition together. The work may be good. The operating context rarely travels.
That reset matters more now. Bain’s 2026 Global Private Equity Report calls the current return environment “12 is the new 5,” arguing that today’s deals require materially faster EBITDA growth and earlier operational execution. PwC sees the same pressure from another angle: operating teams increasingly need specialist capabilities they may only need part-time, pushing leading firms to supplement internal operators with external experts.
The portfolio-level question is therefore bigger than “what worked at Company A?” It is: how do we build a growth motion that gets faster and smarter every time we deploy it without pretending every company has the same problem?
The repeatable unit is the deployment loop — not the last company’s tactic.
How Can PE Funds Repeat Growth Across Portfolio Companies?
PE funds repeat growth by standardizing the operating layer and redeploying the same accountable growth team across companies. The shared layer covers metric definitions, evidence, documentation, and decision cadence. Each portco still gets a fresh diagnosis, company-specific specialists, tailored execution, and an internal handoff when the capability matures.
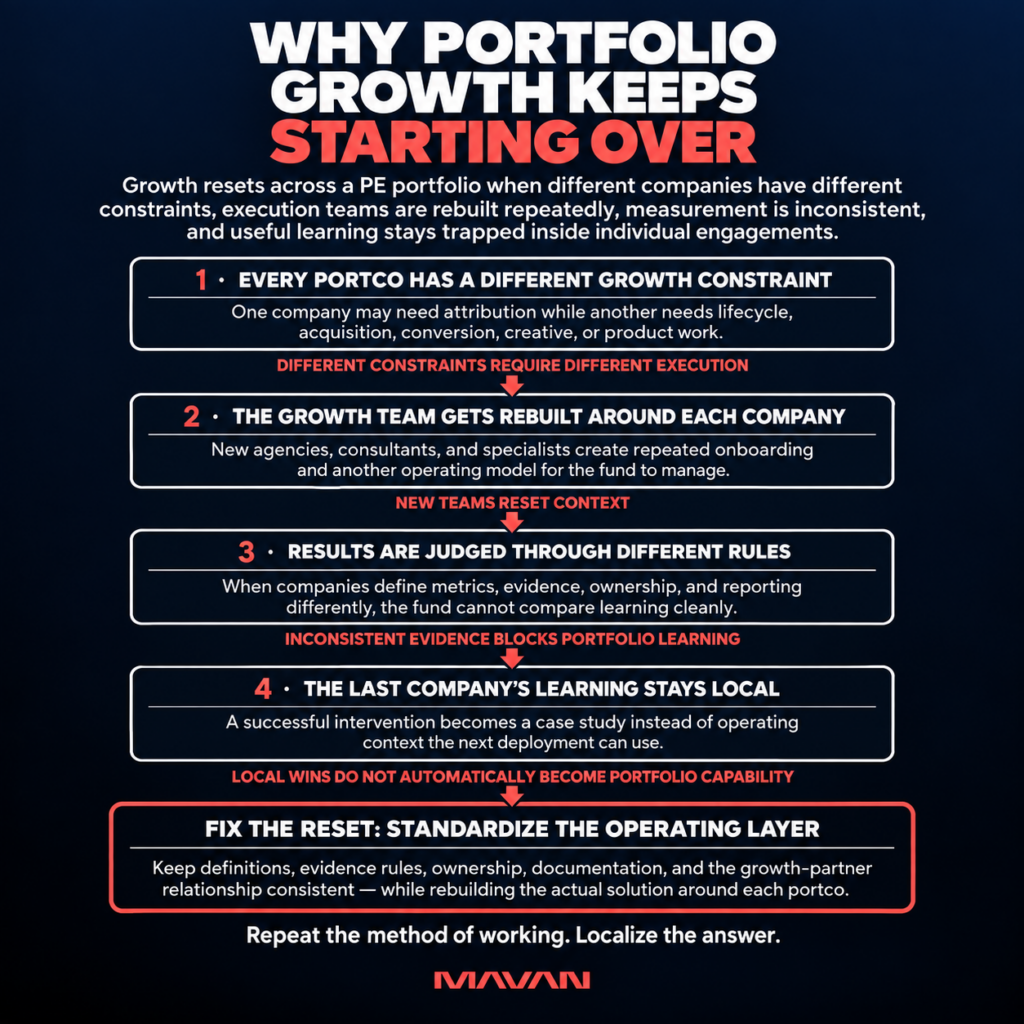
Think about repeatability at two levels.
The fund should have a stable way to decide what matters, how evidence gets judged, how learning gets recorded, and how growth capacity gets deployed. That consistency lowers the reset cost from one company to the next.
The portco should retain freedom over its actual answer. A fintech company may need measurement rebuilt before acquisition can scale. A clean-tech business may need lifecycle infrastructure. A consumer company may have a conversion problem hiding underneath an acquisition complaint.
The same partner can work in all three situations without forcing all three through one play.
That distinction is also what separates this guide from our companion article on what PE funds should want from a portfolio growth partner. That piece covers the relationship and the outcome. This one covers the operating motion that makes portfolio-wide deployment work.
What Should A PE Fund Standardize Across Portfolio Companies?
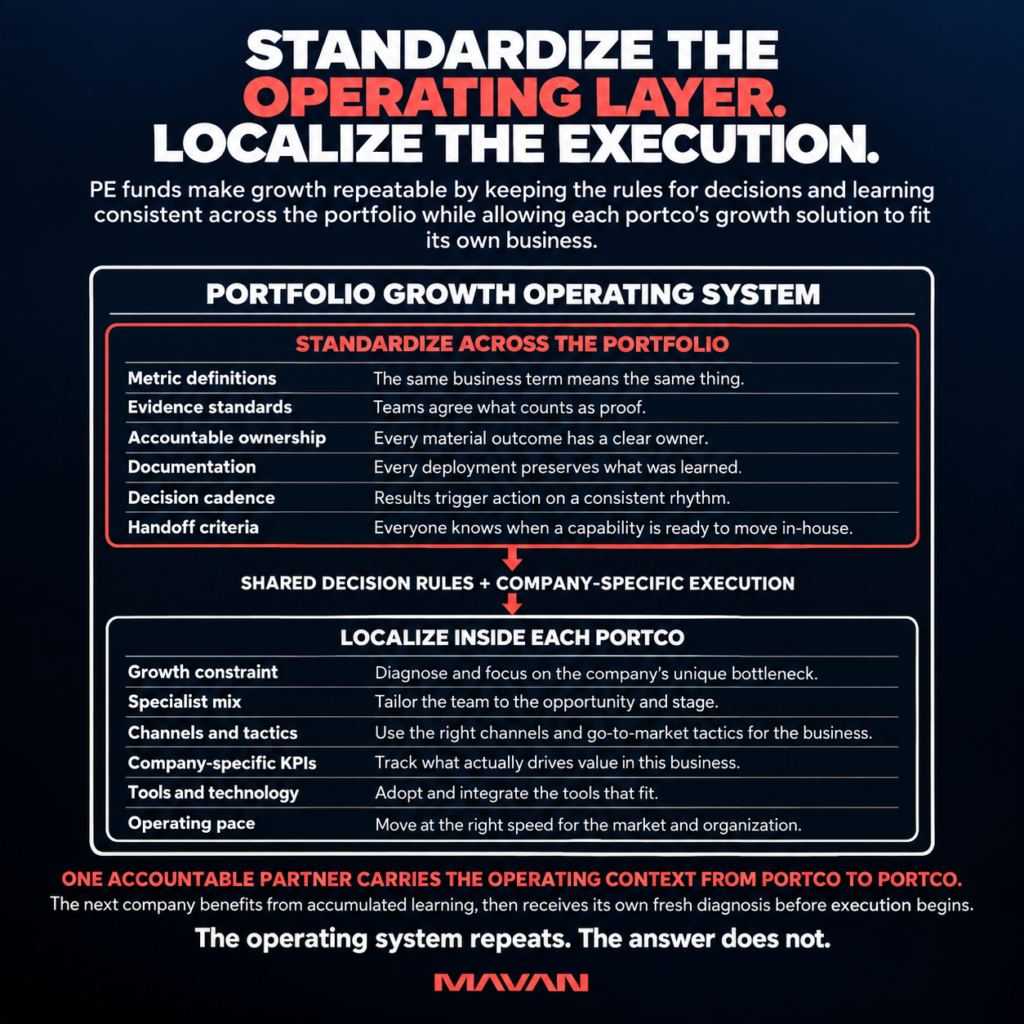
Standardize the rules that make results comparable: how key metrics are defined, what counts as evidence, who owns decisions, how learning is documented, and when a result triggers action. Keep the actual tactics local. Each portco can use different tools, targets, channels, experiments, and specialists because its constraint is different.
The easiest way to kill portfolio repeatability is to standardize at the wrong level.
Forcing every company onto one channel plan creates brittle execution. Letting every company define CAC, activation, or contribution margin differently creates numbers the fund cannot compare.
The useful boundary looks like this:
| Standardize Across The Portfolio | Localize Inside Each Portco |
|---|---|
| Metric definitions | Business-specific KPIs |
| Evidence standards | Evaluation method |
| Accountable ownership | Internal team structure |
| Documentation format | Channels and tactics |
| Decision cadence | Operating pace |
| Escalation rules | Targets and thresholds |
| Handoff criteria | Specialist mix |
| Learning record | Tools and technology stack |
A single source of truth still matters, but it should exist inside each company. Finance, product, growth, and leadership need to read from the same reality there. The fund then standardizes the definitions and reporting interfaces needed to compare companies without forcing identical infrastructure underneath them.
For the mechanics of definitions, owners, sources, and decision thresholds, our board-ready KPI scoreboard guide goes much deeper. This article only needs that layer to be stable enough for portfolio learning to travel.
What Do The Core Portfolio Growth Terms Mean?
- Portfolio Growth Operating System
- The fund-level structure that keeps growth deployments comparable across companies. It defines how outcomes are measured, owned, documented, reviewed, and transferred while allowing each portfolio company to use the tactics, tools, and specialists its own business requires.
- Shared Decision Layer
- The portfolio-wide rules for judging growth work: common metric definitions, evidence standards, ownership expectations, documentation, review cadence, and escalation. It creates consistency in decision-making without requiring every company to operate the same way.
- Portco Source Of Truth
- The agreed data and metric set that one portfolio company uses to judge performance across finance, product, marketing, and leadership. Each company can have its own stack, but its teams should not operate from conflicting versions of reality.
- Embedded Growth Pod
- A cross-functional growth team that works inside a portfolio company as one accountable operating unit. Its specialists change with the problem and can span data, acquisition, conversion, lifecycle, creative, product collaboration, and other growth functions.
- Redeployment Loop
- The recurring portfolio motion of diagnosing a company, deploying the right growth expertise, executing against the constraint, proving the result, transferring mature capability internally, preserving the learning, and moving the growth partner to the next high-value portfolio need.
Why Should The Same Growth Partner Move From Portco To Portco?
The same growth partner should move across portcos because accumulated operating context lowers the reset cost between engagements. The partner already knows the fund’s tempo, reporting expectations, and value-creation language while still diagnosing each company fresh. That adds specialist capacity without permanently staffing every growth capability inside every business.
There is a large difference between repeating a relationship and repeating an answer.
The first creates leverage. The second creates mistakes.
A partner that already understands the sponsor relationship does not need to relearn how decisions get made, what the fund considers credible evidence, or how operating updates need to land. That context compounds across deployments.
The actual team inside the portco can still change.
That flexibility is central to MAVAN’s model. Our growth services span data, acquisition, conversion, lifecycle, creative, and related growth functions. We can fill the gaps a company actually has rather than selling it the same fixed scope every time. MAVAN’s site describes the model similarly: work starts by taking apart the growth engine, then filling in around the strengths the company already has.
Angus Kirby, Director of Marketing at Titan, described that experience as having a “top-tier growth team on demand,” with specialists organized through one point of contact. The important operational feature is coordination: the specialists work as one team rather than becoming another set of vendors the portco has to integrate.
Our guide comparing embedded growth operators with agency retainers covers that operating-model distinction in depth.
Which Portfolio Company Should You Deploy Into First?
Start with the portco where growth is material to the value-creation plan and the team can support a clean read. Look for a measurable constraint, executive access, usable data, execution capacity, and enough upside to matter. Avoid choosing a company solely because it is in crisis; noisy conditions make transferable learning harder.
The first deployment should give the fund an answer it can use.
Five factors usually matter most:
- Value-creation relevance: Would solving this constraint materially improve revenue, efficiency, margin, or exit readiness?
- Executive access: Will leadership give the team access across the functions the diagnosis may need?
- Measurement readiness: Can the company establish a credible baseline and read the result?
- Execution readiness: Can people actually ship the changes once the constraint becomes clear?
- Portfolio learning value: Will this deployment teach the fund something useful about future growth needs?
The best starting company does not need perfect data or a perfect team. It needs enough visibility and organizational access to distinguish signal from noise.
That is also why diagnosis should precede the execution scope. Our 360° Growth Analysis looks across the growth system before deciding where deeper work belongs.
In one MAVAN engagement, that type of full-system read surfaced roughly $350,000 in monthly paid spend flowing into an evergreen campaign that had never been close to profitable. The campaign itself was only the visible symptom. Conflicting data, stale modeling, and misleading dashboards had allowed the waste to survive.
The next portco may have a completely different leak. That is precisely why the diagnosis repeats while the answer changes.
What Is The Repeatable Deployment Loop For Portfolio Growth?
Run the same seven-step deployment loop at each portco: prioritize the outcome, embed one accountable team, diagnose the whole growth system, assemble specialists around the real constraint, execute and measure, hand mature capability to the internal team, then redeploy the partner with the learning intact. The next company still starts with a fresh diagnosis.
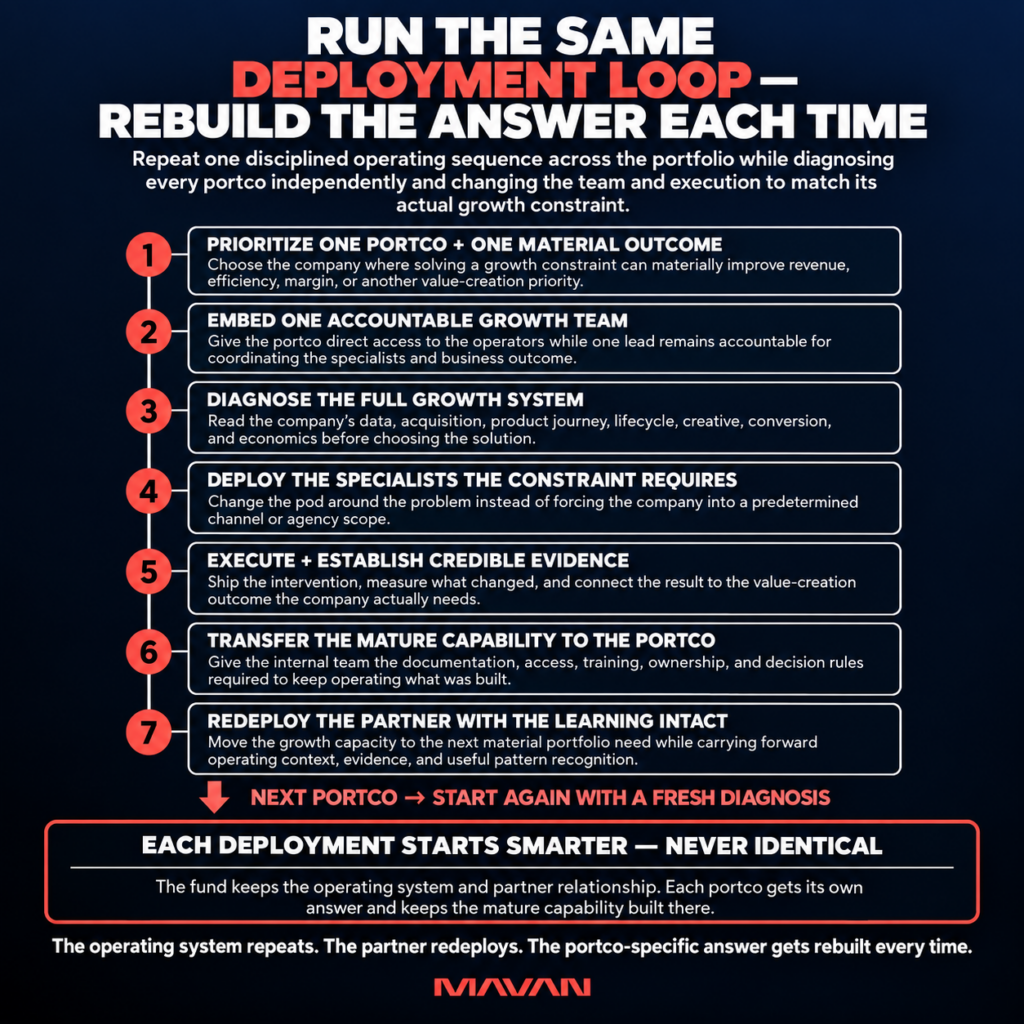
Here is the operating sequence:
- Prioritize one portfolio company and one material outcome. Tie the deployment to a specific value-creation need, such as revenue growth, acquisition efficiency, conversion, retention, or another business outcome important to that asset.
- Embed one accountable growth team. Give the portco direct access to the operators doing the work while keeping one person accountable for coordinating the specialists and the outcome.
- Diagnose the company’s full growth system. Read its data, acquisition, product journey, lifecycle, creative, conversion, and economics before deciding where the real constraint sits.
- Deploy the specialists that constraint requires. Change the pod around the problem rather than squeezing the company into a predetermined agency scope.
- Execute and establish credible evidence. Ship the intervention, define how the result will be read, and connect the work to the business outcome the value-creation plan cares about.
- Transfer the mature capability to the portco. Give the internal team the documentation, access, training, ownership, and decision rules required to sustain what has been built.
- Redeploy the partner with the accumulated learning. Move the operating capacity toward the next material portfolio need, then diagnose that company independently before choosing its solution.
This is where the distinction between the analysis, the execution, and the result matters. A diagnostic can surface the constraint quickly. Building the solution takes its own amount of time. The business outcome may need another window before it becomes measurable.
Treating all three as one arbitrary “90-day result” creates a promise the data may not support.
The stable part is the loop.
How Do You Carry Learning Forward Without Copying The Last Portco’s Tactics?
Carry forward the operating context, evidence, and documented learning while rebuilding the company-specific answer. The partner should preserve what problem existed, what conditions mattered, what changed, what the result showed, and what remained uncertain. The next portco uses that context to ask better questions while still running its own diagnosis.
The fund should get smarter after every deployment.
That does not require turning the operating team into a growth implementation department. It requires a consistent learning record that the growth partner carries forward.
A useful record answers a small set of questions:
What was actually constraining growth? Which conditions made the intervention relevant? What changed? What happened afterward? How strong was the evidence? Which dependencies mattered? What should we look for when the same pattern appears again?
That record becomes context, not a mandate.
For example, ElevenLabs showed that paid Search could scale internationally while maintaining a sub-12-month payback across more than 20 markets. That result can inform how we think about another international acquisition problem. It does not establish that Search is the answer for the next company.
The growth partner carries the pattern recognition.
The next portco supplies the local reality.
That combination is what lets portfolio learning compound without flattening businesses into one template.
When Should The Growth Partner Hand Off One Portco And Redeploy?
Handoff when the portco has a named owner, stable access to the tools and data, documented decision rules, and enough skill to operate the mature system without daily outside supervision. That frees the growth partner for the next portfolio constraint while keeping the fund-level relationship and accumulated context intact.
A handoff is a capacity decision as much as a training decision.
Once an internal team can confidently operate a mature system, leaving outside specialists attached to routine work creates little portfolio leverage. The better use of that capacity may be the next constraint at the same company or another company entirely.
ElevenLabs is a clean example of the portco side. MAVAN scaled Search from zero to a high-six-figure monthly budget while maintaining sub-12-month payback and expanding across more than 20 international markets. Once the channel was proven, Head of Growth Luke Harries said the team could “confidently transition the program to our in-house team.”
That handoff did not invalidate the outside relationship.
It meant the internal team now owned a capability it was ready to run.
For the deeper question of what the fund and portco should retain from that relationship, see our companion guide on what PE funds want from a portfolio growth partner.
How Should A PE Fund Decide Where To Redeploy Next?
Redeploy based on portfolio priority and evidence rather than because one tactic worked once. Use four decisions: proceed, adapt, pause, or stop. A strong result earns another deployment where the underlying problem is relevant. A different result updates the playbook. The fund is building a repeatable operating motion, not a mandatory portfolio rollout.
A portfolio does not need one giant launch date.
It needs a queue.
The operating team can rank the next deployments by VCP importance, expected value, management readiness, and whether the available growth capacity fits the problem. That keeps scarce specialist time attached to the assets where it can matter most.
Use four simple decisions after every deployment:
- Proceed: the operating motion worked and another relevant opportunity is ready.
- Adapt: the approach produced useful evidence, but the next context requires meaningful changes.
- Pause: the opportunity may be real, but the company lacks access, ownership, data, or execution readiness.
- Stop: the evidence does not support further investment in that motion.
This discipline also limits portfolio cannibalization of management attention. Running ten transformations badly is not more repeatable than running one.
For funds assessing whether a specific outside team has the operating capacity to support this model, that is a different question. Our guide on how to evaluate a portfolio growth partner covers the diligence process separately.
How Does A Shared Growth Operating System Help The PE Operating Team?
A shared growth operating system gives the operating team leverage without turning it into the day-to-day growth department for every asset. The fund sets the standards and priorities, the growth partner carries cross-functional execution from company to company, and each portco keeps ownership of the capabilities that become mature enough to run internally.
This model matches the reality PE operating teams already face.
PwC reports that operating partners now work across growth, cost, and risk while firms struggle to carry every specialist capability internally. Its research describes leading firms supplementing their teams with external advisors who can bring targeted expertise when a portfolio company needs it.
Growth fits that pattern well because the required expertise moves.
One quarter may demand attribution and paid acquisition. Another company may need lifecycle, conversion, or creative. Building every skill permanently into every portco is expensive, and building every skill at the fund level turns the operating team into an execution agency.
Redeployable capacity sits between those extremes.
The fund retains the relationship, standards, priorities, and accumulated context.
The embedded partner supplies the surge capacity.
The portco keeps what gets built.
Frequently Asked Questions About Repeating Growth Across PE Portfolio Companies
Do All Portfolio Companies Need The Same Growth Tech Stack?
No. Portfolio repeatability does not require one warehouse, CRM, attribution platform, or marketing stack everywhere. The fund needs comparable definitions and evidence, while each portco can keep technology suited to its business. Standardize the interfaces that support decisions and learning; localize the underlying tools when local needs justify them.
Should A PE Fund Use The Same Growth Playbook At Every Portco?
Use the same operating method, then rebuild the execution around each company. A shared playbook can govern diagnosis, ownership, evidence, documentation, and handoff. Channels, creative, lifecycle motions, product changes, targets, and specialist mixes should follow the portco’s actual constraint rather than the previous company’s success.
Who Carries Learning From One Portfolio Company To The Next?
The growth partner should carry implementation context forward while the fund preserves the portfolio-level learning standard. The next portco should not receive a copied recipe. It should benefit from better questions, known patterns, documented evidence, and faster orientation — then run its own diagnosis before deciding what to execute.
Can One Growth Partner Work Across Several Different Industries?
Yes, if the operating model adapts the team and tactics to the problem. Cross-industry work should rely on repeatable diagnosis, measurement, execution, and accountability rather than one vertical-specific channel strategy. MAVAN’s case studies span different industries and growth functions, illustrating that distinction.
Can A Growth Partner Work Across Multiple Portcos At The Same Time?
Yes, when the partner has a pod-based operating model and enough senior capacity to preserve quality across deployments. Parallel work should still have clear owners, scopes, and decision cadences at each company. If the fund is deciding whether a provider actually has that bandwidth, evaluate that separately from the operating playbook itself.
What Happens If The Second Portco Gets A Different Result?
A different result updates the learning. Check whether the difference came from market conditions, the underlying constraint, execution, or measurement. Then adapt, pause, or stop. Portfolio repeatability does not require equal results; it requires a disciplined process that turns different outcomes into better decisions for the next deployment.
How Can PE Funds Make Growth Repeatable Across The Portfolio?
PE funds make growth repeatable by keeping the portfolio operating layer consistent while adapting execution company by company. Shared definitions and evidence make learning comparable; one redeployable growth partner carries operating context and specialist capacity across the book. Each portco receives a fresh diagnosis, tailored execution, and a handoff when the capability is ready to live internally.
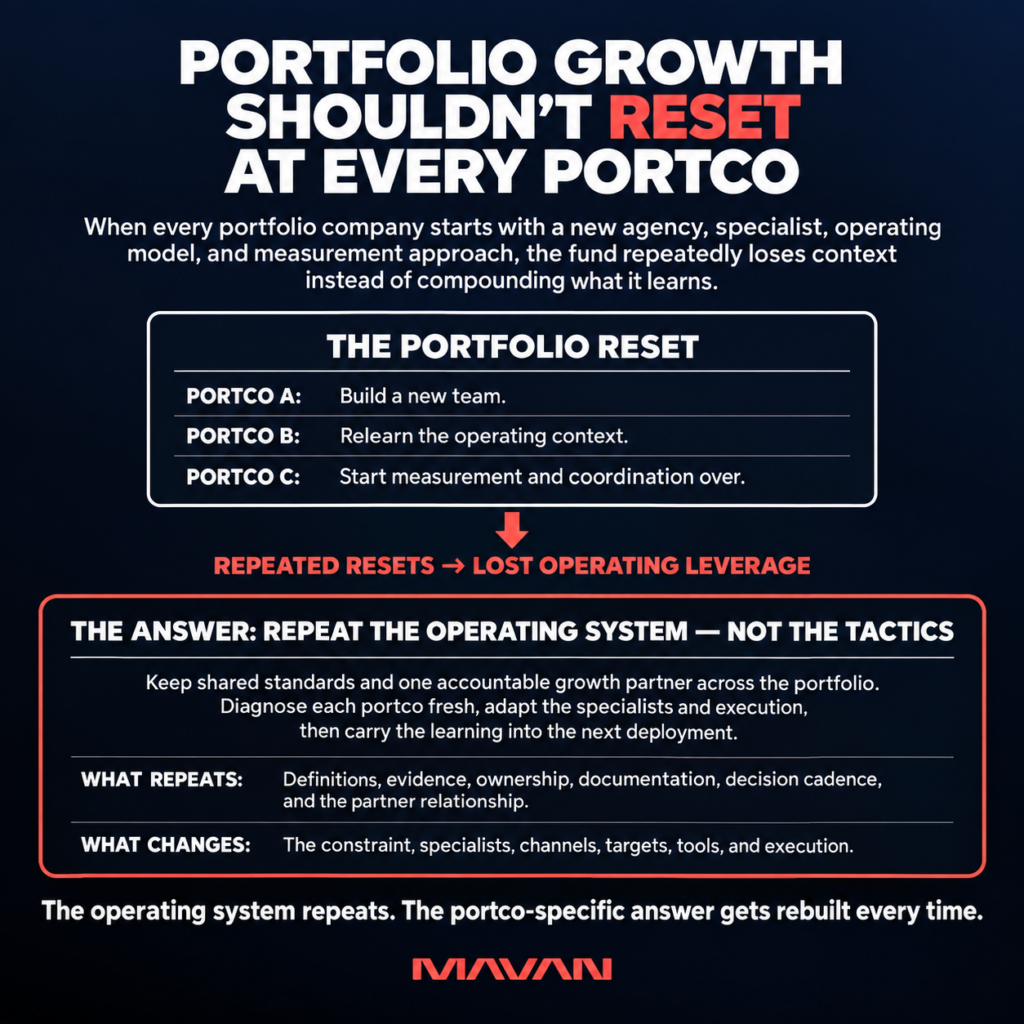
The fund therefore gets better at deploying growth without becoming the growth team for every asset. The partner gets more useful as portfolio context accumulates. Each portfolio company still gets the solution its own business requires.
The operating system repeats. The partner redeploys. The portco-specific answer gets rebuilt every time.
If one company in the portfolio has a material growth constraint and your operating team needs more capacity, start there. Run a 360° Growth Analysis to find the real constraint, then deploy the right team against it. Once that capability can live inside the portco, move the operating capacity to the next place it can create value.
Casey Rock is Content Director at MAVAN, where he helps turn complex ideas into clear, strategic content that drives growth. With over 15 years of experience across content strategy, SEO, media, and digital marketing, Casey focuses on building content systems that connect audience insight, brand storytelling, and measurable business outcomes.
Book a complimentary consultation with one of our experts
to learn how MAVAN can help your business grow.
Want more growth insights?
Thank you! form is submitted
[hubspot type=”form” portal=”20951211″ id=”9c538ed2-fb12-45f1-a573-ad7953c058cc”]
Related Content
-
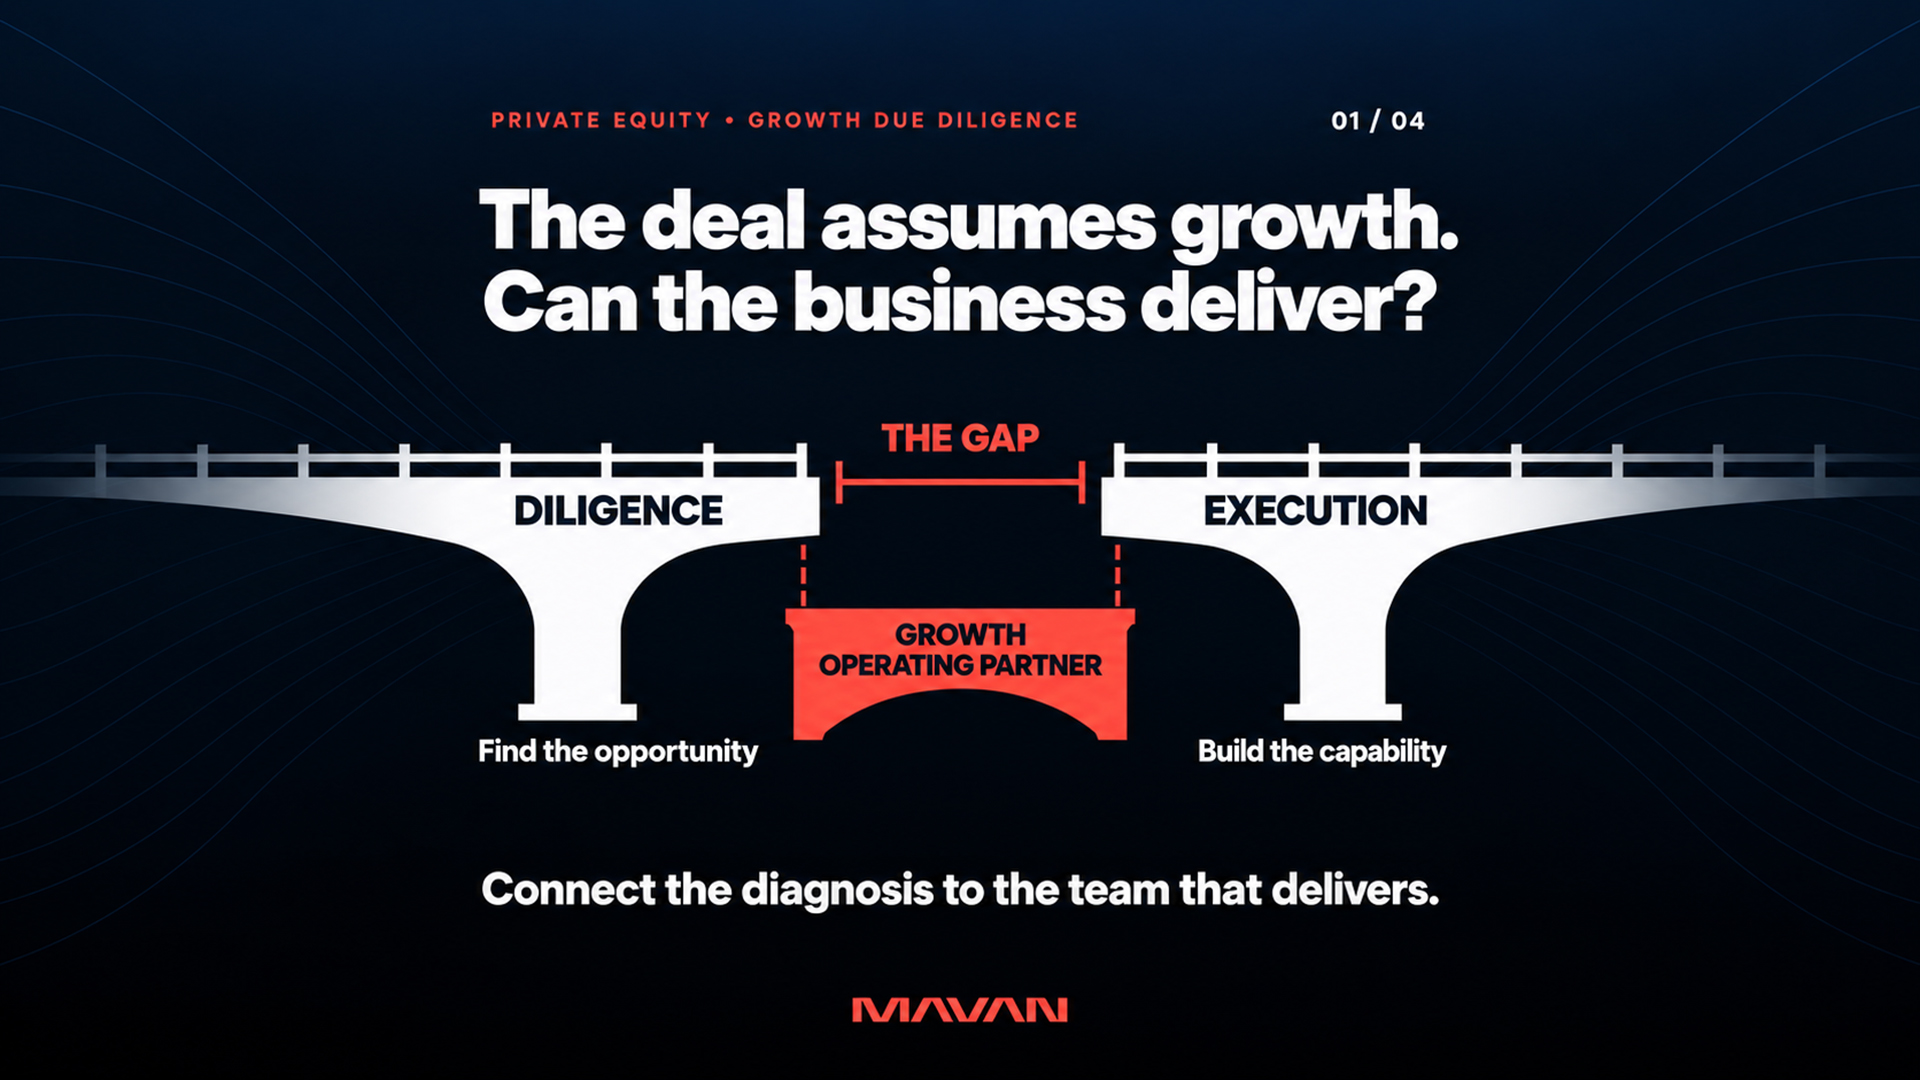
Who Does Growth & GTM Due Diligence for PE Deals?
Four kinds of provider run growth and go-to-market due diligence for private equity deals. Strategy consultancies test the market. Specialist commercial diligence firms audit the pipeline. Go-to-market boutiques rebuild the sales motion. And growth operating partners examine the full revenue engine from inside the business, then stay to operate it after close.
-
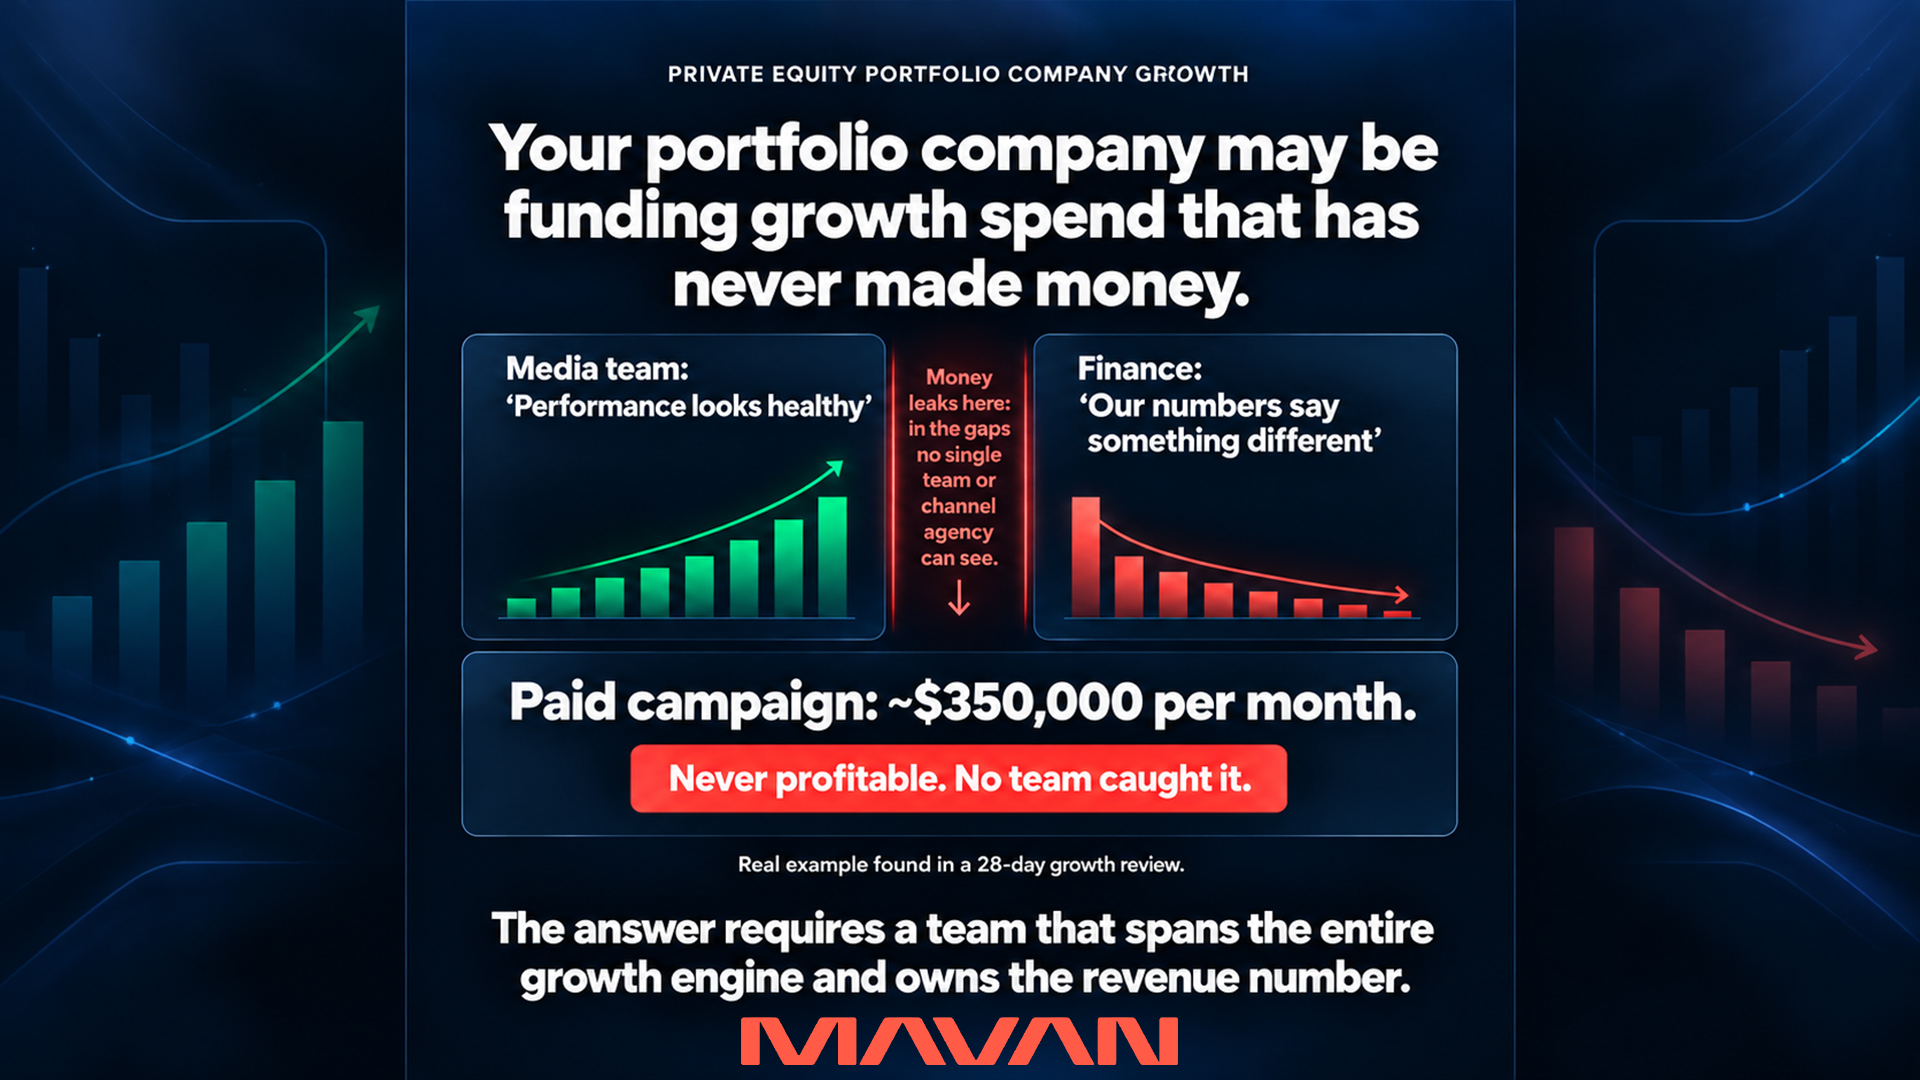
Who Is The Best Growth Partner For PE Portfolio Companies?
The best growth partner for a private equity portfolio company behaves like an operating partner you deploy, not an agency you brief. It reads the whole growth system before it spends, owns a revenue number alongside management, and leaves the capability behind so the sponsor can redeploy it.
-
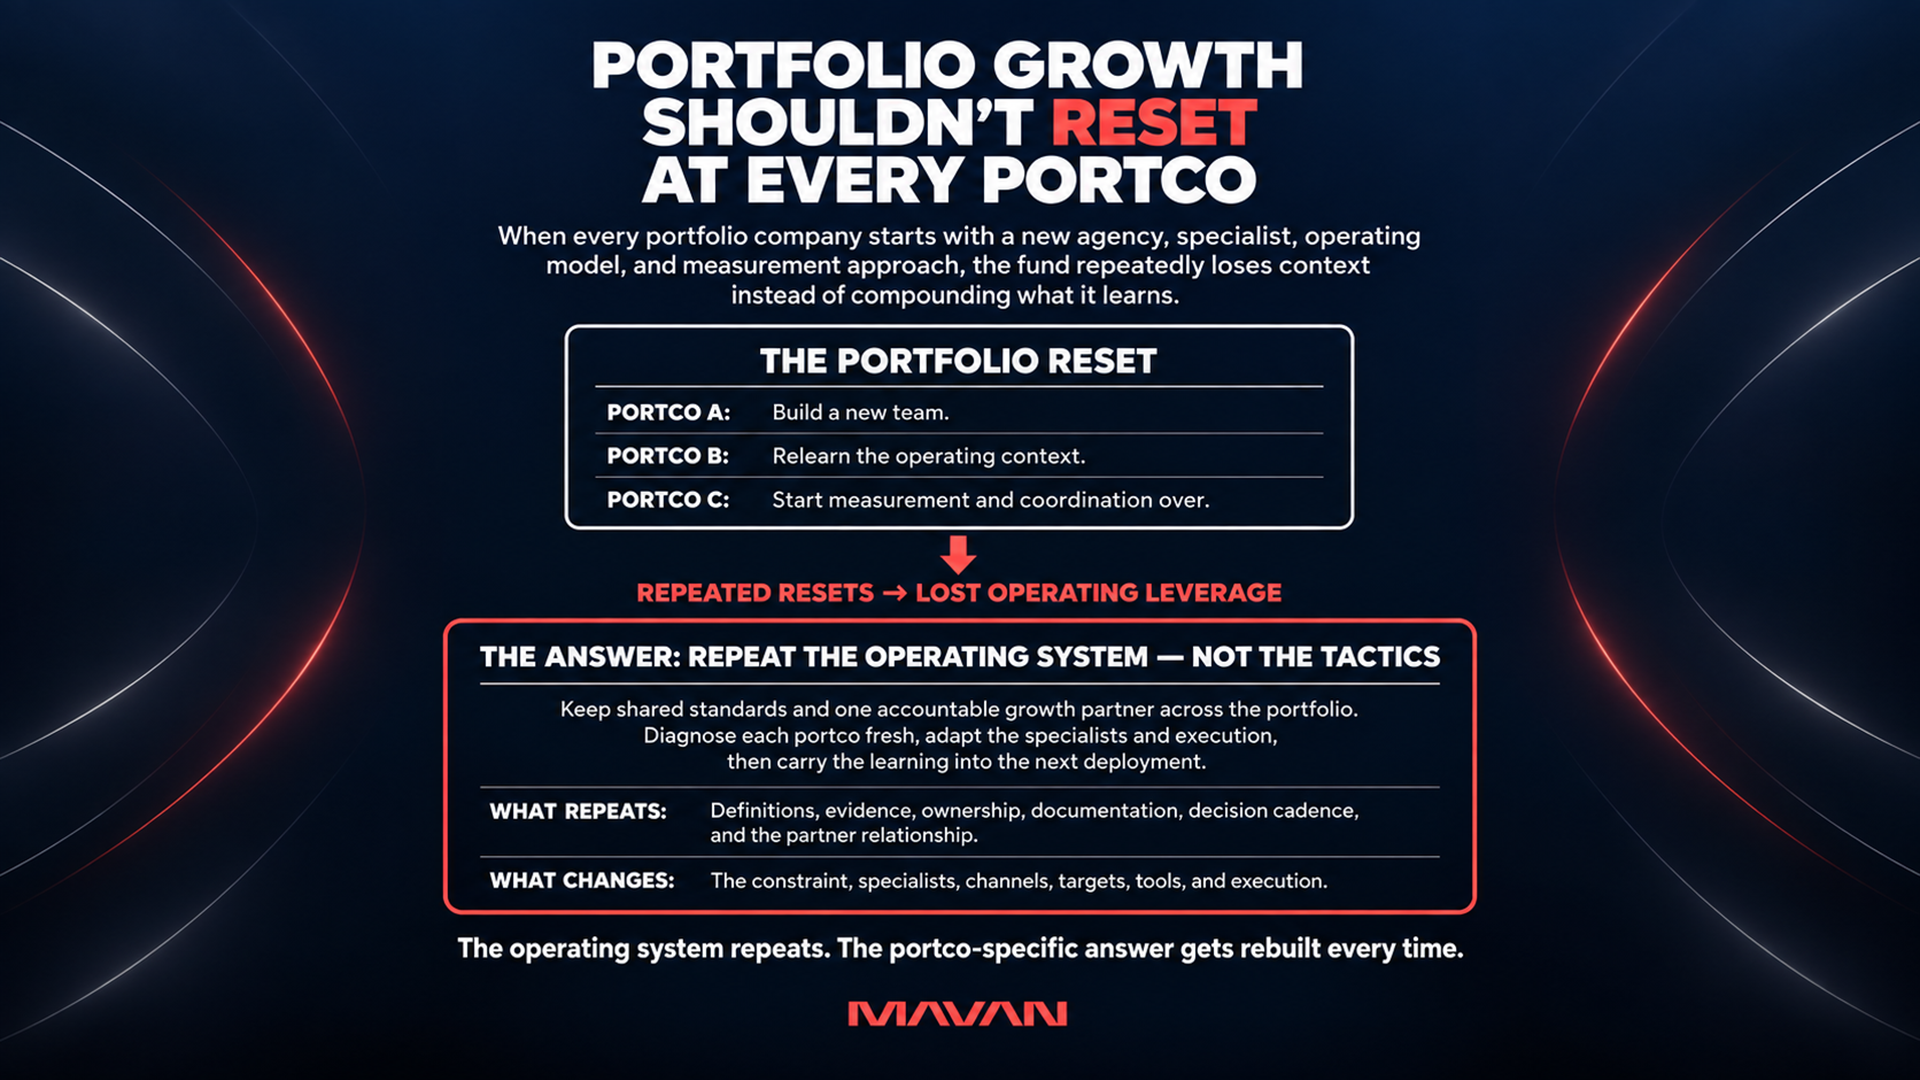
How Can Private Equity Funds Repeat Growth Across Portfolio Companies?
Growth becomes repeatable across a VC or PE portfolio when the fund installs one operating system instead of referring each company to a different specialist. The system has three parts: a single source of truth every team trusts, a board-ready scoreboard of ten to twelve metrics, and an embedded pod that diagnoses the real constraint in ninety days before anyone spends more.