
The customer retention strategies that reduce churn start before the renewal date. Keep the promise that won each customer, shorten the path to first value, and recover failed payments. Then trigger lifecycle messages on behavior, aim saves at customers who will respond, and track net revenue retention by cohort from one source of truth.
TLDR — How to Keep More Customers and Grow NRR
- Churn starts at the sale, not at renewal.
- Split churn into cancellations and failed payments.
- Fix failed payments first. No product work needed.
- Track retention by cohort, not one blended rate.
- Shorten the path to each customer’s first win.
- Trigger lifecycle messages on behavior, not dates.
- Aim saves at who will respond, not who’s riskiest.
- Test every save offer against a holdout group.
- Report NRR next to GRR, by cohort, every month.
- See how MAVAN’s growth operators can help.
Churn Starts Long Before the Cancel Button
For years, the churn playbook ran on one idea. Build a model, find the customers most likely to leave, and send them an offer. Eva Ascarza, then a marketing professor at Columbia Business School, tested that idea in two field experiments. Her results, published in the Journal of Marketing Research, turned it upside down. Picking customers by how likely they were to respond, rather than how likely they were to leave, cut churn rates by 4.1 to 8.7 percentage points. The American Marketing Association reported those results when it honored the paper in 2023. In some cases, targeting the riskiest customers raised churn instead.
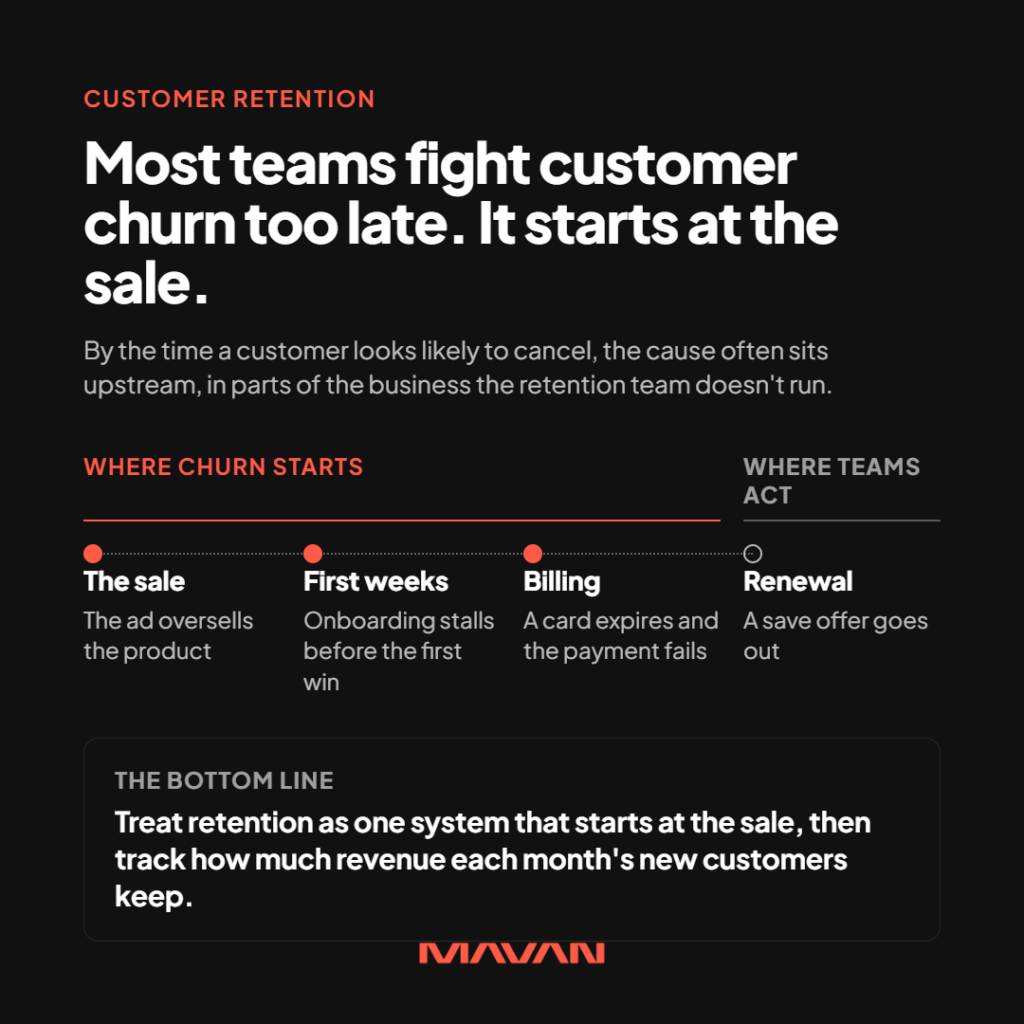
Most retention work starts late and aims at the wrong target. By the time an account looks risky, the cause often sits upstream. It may live in an ad that oversold, an onboarding flow that stalls, a card that expired, or a dashboard nobody trusts.
Those causes cost more than they did five years ago. Software revenue growth has slowed from about 20% a year to roughly half that, Bain & Company reported in April 2026. Net revenue retention (NRR) has fallen about 8 points since 2021. Meanwhile, winning a new customer costs five to 25 times more than keeping one, depending on the study and industry, Harvard Business Review noted. For a PE sponsor chasing double-digit EBITDA growth, the existing customer base is the closest source of margin in the business.
This guide covers retention strategy, the order of work to reduce churn, churn prediction, predictive churn models, and net revenue retention in SaaS. It closes with what retention means for PE sponsors and how we approach it at MAVAN.
What Do the Key Retention Terms Mean?
These eight terms come up throughout this guide. Churn and lift describe what you’re trying to change. Retention strategy, cohorts, and churn prediction describe how you change it. NRR and GRR describe how you measure it. Shared definitions also stop teams from arguing over whose number is right.
- Churn
- The share of customers, or revenue, lost in a period. Voluntary churn means a customer cancels. Involuntary churn means a payment fails and the subscription lapses.
- Customer Retention Strategy
- A company’s plan to keep customers and grow what they spend. It runs across acquisition, product, lifecycle messaging, billing, and data.
- Net Revenue Retention (NRR)
- The recurring revenue a fixed group of customers produces a year later, after upgrades, downgrades, and cancellations. Revenue from new customers doesn’t count.
- Gross Revenue Retention (GRR)
- The same math as NRR, minus upgrades and price increases. It can’t top 100%, so it shows pure loss.
- Cohort
- A group of customers who joined in the same period, such as one month, tracked together over time.
- Churn Prediction
- Using past behavior to estimate which current customers are likely to leave, and when.
- Predictive Churn Model
- The rules or statistical model that turns customer data into a churn risk score for each account.
- Lift
- How much a retention action changes a customer’s odds of staying, compared with doing nothing.
What Is a Customer Retention Strategy, and Where Does It Start?
A customer retention strategy is a company’s plan to keep customers and grow what they spend over time. Strong strategies start before the sale. It covers the promise in the ad, the first weeks of use, billing, lifecycle messages, and the data that ties them together. Churn often begins far upstream of the team asked to fix it.
Most companies hand retention to one team. In B2B software, it lands with customer success. Consumer subscription companies give it to a lifecycle marketer and an email tool. Both teams work late in the customer relationship, yet churn rarely starts there. Recurly, a subscription billing platform, names poor onboarding as the single biggest driver of voluntary cancellations. Subscribers who don’t see core value in their first weeks are highly likely to leave, the company says in its churn benchmark research.
Why Does Churn Start Before the Sale?
A customer’s first impression forms before they ever log in. It comes from the ad, the landing page, or the sales call that won them. When the product doesn’t match that promise, the customer feels the gap fast. Dan Barnes, MAVAN’s President, spent years scaling games at Zynga and Machine Zone. He frames the link this way.
“The first impression a player has inside your software is a direct function of how you acquired them and what you promised them to get there. If those two things aren’t continuous, you’re burning the trust you spent money to earn.” — Dan Barnes, President, MAVAN
Eric Seufert, a member of the MAVAN Advisory Group and founder of Mobile Dev Memo, warns that a weak first experience can close the door for good. As he put it, people who meet an immature product “confront the flaws with it and they churn, you will probably never be able to get another opportunity to serve them.” That’s why retention belongs in acquisition reviews as well as renewal meetings. A channel that brings in cheap sign-ups who leave in month two isn’t cheap.
Who Should Own Retention?
One team should own the number, but many teams have to move it. Product controls the first-value moment. Marketing controls the promise. Finance controls billing rules and pricing. Data decides whether anyone can see the problem at all. In telecom, McKinsey found that churn leaders ran retention through cross-functional teams from marketing, finance, operations, IT, and legal. Each team owned results for a set of customer segments and could test new treatments quickly, the firm wrote.
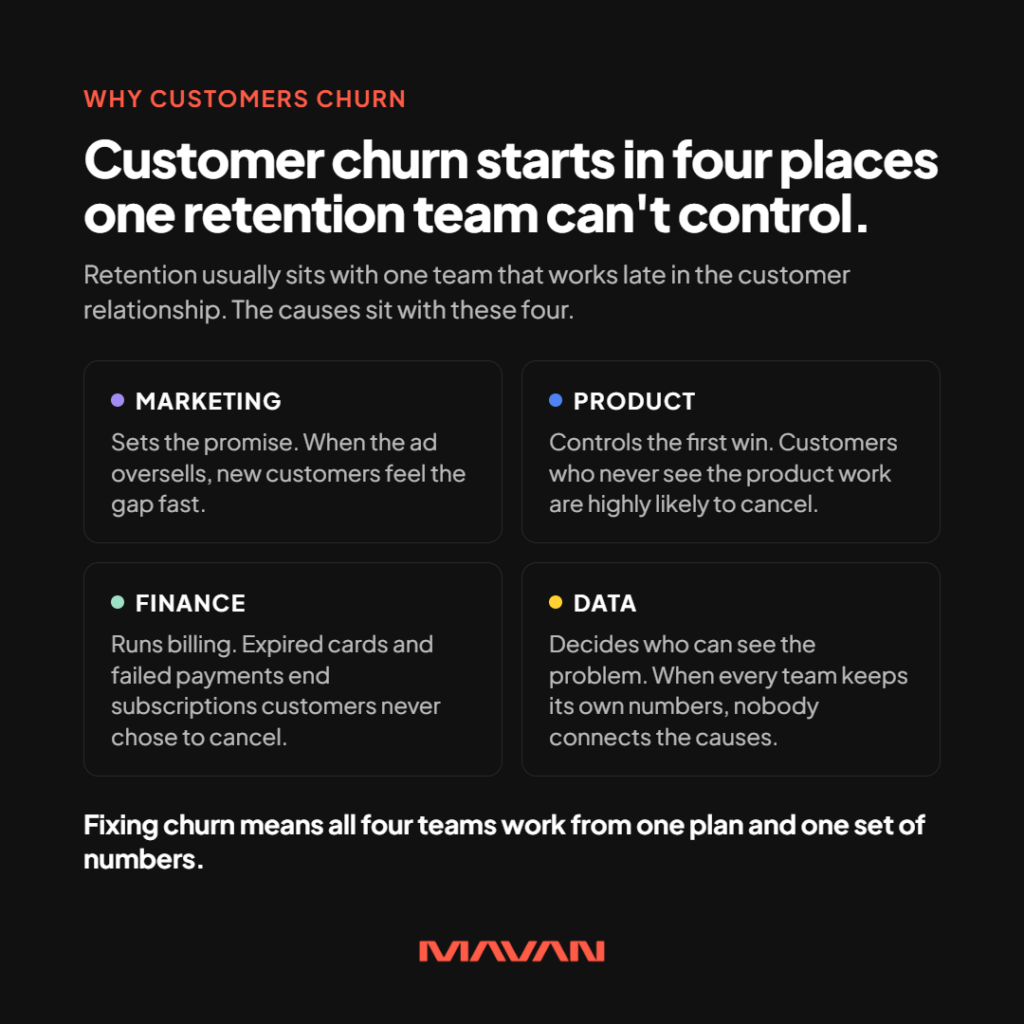
Matt Widdoes, MAVAN’s Founder and CEO, has seen what happens without that view. A problem in one part of the system shows up as a retention dip somewhere else, and nobody connects the two.
“It doesn’t matter the size of your company, this is just one of the many things in a complex growth system that can be the hidden reason why CAC has gone up, retention or monetization has come down.” — Matt Widdoes, Founder & CEO, MAVAN
Our guide on how to structure a growth team explains why silos make these blind spots worse.
What Customer Retention Strategies Actually Work?
The customer retention strategies that work each target a specific cause of churn. Match the ad to the product. Shorten the path to first value. Recover failed payments. Trigger lifecycle messages on behavior. Offer a pause before a cancel. Build expansion into the product. Win back former customers. Then measure each one by cohort.
The table below maps each strategy to the problem it solves. Its third column shows the first number to watch.
| Strategy | What It Fixes | First Number to Watch |
| Match the ad to the product | Customers who arrive expecting something else | Early retention by acquisition channel |
| Shorten the path to first value | Customers who never see the product work | Share of new customers who reach a first-value action |
| Recover failed payments | Involuntary churn from expired or declined cards | Revenue recovered from failed payments |
| Trigger lifecycle on behavior | Generic messages that customers ignore | Engagement and revenue by lifecycle program |
| Offer pause and downgrade paths | Customers who need a break, not an exit | Share of cancel attempts that pause instead |
| Build expansion into the product | Accounts that never grow | Expansion revenue as a share of new revenue |
| Win back former customers | Treating every cancellation as final | Reactivations per churned cohort |
Which Strategies Pay Off First?
Failed payments are the quickest place to start. Involuntary churn happens when a card expires, a bank flags a renewal, or a billing limit hits. The customer never chose to leave. Recurly calls this kind of churn largely preventable through smart retries, card updater services, and payment reminder emails. It advises SaaS companies with high churn to audit involuntary churn first, since it’s often fixable without any product changes.
The pause button comes next. Some customers want a break, not an exit. In Recurly’s 2026 State of Subscriptions research, 38% of consumers said they prefer pausing to canceling. Brands that offered a pause saw pause usage rise 337%, and three in four of those subscribers came back within months. The same research found that nearly one in four new subscriptions now comes from a customer who once canceled. For consumer and on-demand businesses, a churned customer is often a future customer.
Why Do So Many Lifecycle Programs Fail?
Lifecycle marketing means email, push, SMS, and in-app messages timed to each customer’s stage. It’s the most common retention tool, and one of the most misused. Many programs send messages on a calendar instead of in response to what customers do. Dan Barnes puts it bluntly.
“The ROI on lifecycle channels looks low in isolation. That’s not because they don’t work. It’s because most publishers use them generically. You haven’t played in three days. Come back. That’s not lifecycle. That’s spam.” — Dan Barnes, President, MAVAN
The fix sits in the data, not the copy. In Barnes’s view, lifecycle depth depends on how well a company ties each customer’s purchases, behavior, and preferences to one identity. “Fix that first, and lifecycle starts to compound,” he says. A message that reflects what a customer just did, or stopped doing, earns attention. Generic nudges teach people to ignore you.
Recurly’s research points the same way. When customers cancel because they don’t see value, it recommends usage nudges, structured onboarding, and re-engagement over discount-led save offers. In its words, the issue is perceived value, not price.
Where Does Expansion Fit?
Retention keeps revenue, and expansion grows it. Existing B2B SaaS customers now generate 40% of new ARR, and more than half for companies above $50 million in ARR, according to Benchmarkit’s 2025 benchmark report. Yet few companies run expansion with the rigor they bring to new sales. Fewer than 20% of B2B SaaS companies even measure an expansion CAC ratio, Benchmarkit’s summary of the data noted. In our view, expansion works best when it follows value. A customer who adds seats because the team relies on the product has a reason to stay. Push a customer into a bigger tier they don’t use, and you’ve set up a future downgrade.
How Do You Reduce Churn Without Guessing?
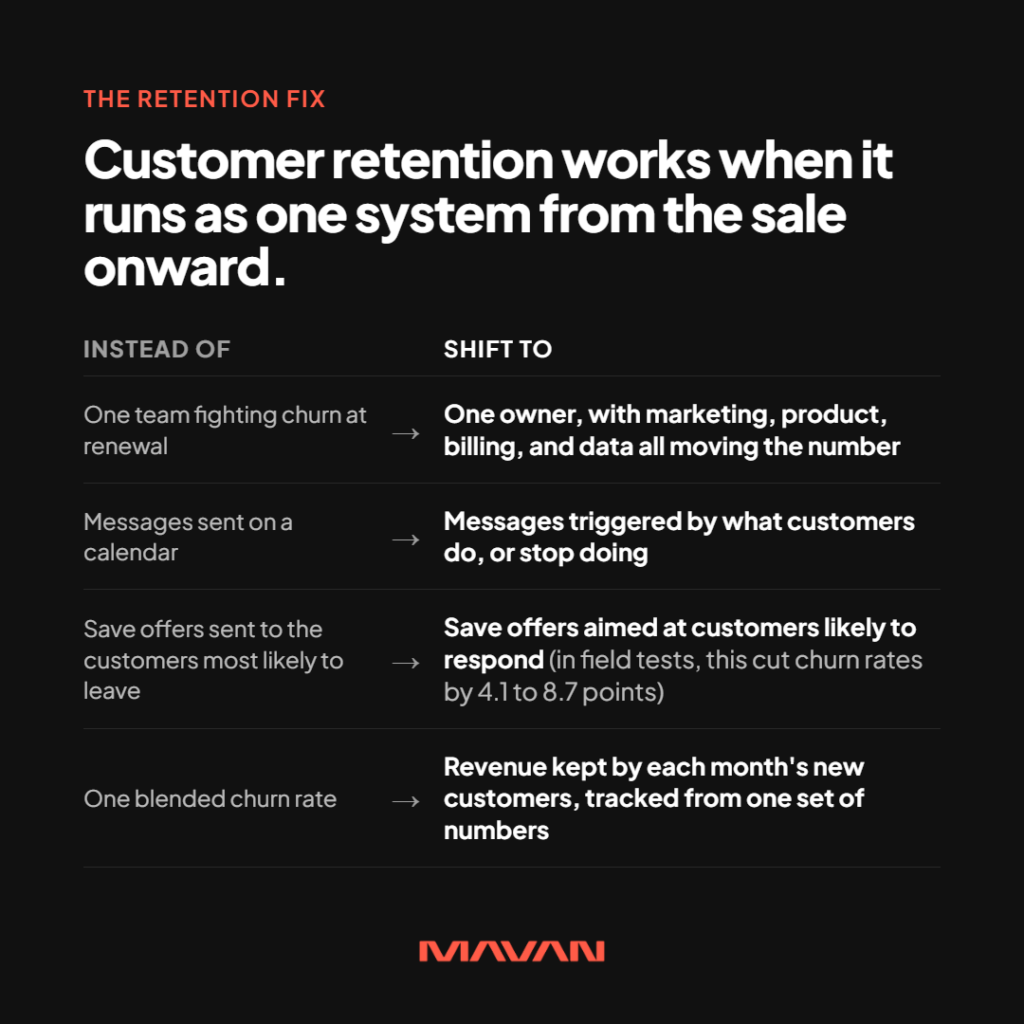
To reduce churn, sort it before you fix it. Separate cancellations from failed payments, agree on one set of numbers, and find the cohort and moment where customers stop. Then fix causes in order of speed and certainty. Test every save tactic against a holdout group, because some well-meant offers push customers out.
What Order Should You Fix Churn In?
We run churn work in a set order. Each step makes the next one cheaper and more accurate.
- Split churn by type and unit. Separate voluntary cancellations from failed payments. Then track churn by customer count and by revenue. Recurly notes the two can diverge, so 3% customer churn could mean 5% revenue churn if larger accounts are leaving.
- Recover failed payments. Turn on smart retries, card updates, and payment reminders before you touch the product. This revenue often comes back without any product work.
- Agree on one set of numbers. Finance, product, and growth need one definition of churn and one place where the data lives. “You have to have a single source of truth, full stop,” says Dan Barnes. Without it, every team can find a number that defends its own work.
- Find the break point by cohort. Plot retention curves by signup month, channel, plan, and segment. Look for the week or month where the curves bend down, and for cohorts that bend sooner than others.
- Fix the first-value moment. Find the earliest action that separates customers who stay from customers who leave. Then remove the friction between sign-up and that action. Our guide to finding your users’ desire paths shows how.
- Rebuild lifecycle around behavior. Replace calendar sends with triggers tied to what customers do, skip, or stop doing.
- Test every save tactic against a holdout. Hold back a random group from each offer or outreach. Compare churn and revenue between the groups before you scale anything.
Why Track Retention by Cohort?
A single blended churn rate hides more than it shows. Years of loyal customers can mask new ones who leave fast. Heavy acquisition spend can do the same thing. Barnes recommends tracking “retention by cohort vintage,” such as Day 30 retention for customers acquired in a given month, followed forward over time.
“It shows you whether your product is actually improving or whether you’re papering over churn with spend.” — Dan Barnes, President, MAVAN
Day 30 suits consumer apps. B2B teams can apply the same logic with quarterly cohorts and revenue retention. Our Board-Ready Scoreboard shows how to put cohort retention in front of a board without burying it.
Which Save Tactics Backfire?
Proactive outreach feels safe, but the research urges caution. In a separate field experiment with 65,000 customers of a South American wireless carrier, Ascarza and her co-authors recommended better-fitting plans to customers. Some customers left instead, Columbia Business School reported. Ascarza called the outreach a wake-up call that prompted those customers to exit.
Blanket discounts carry a similar risk. They cut margin on customers who would have stayed anyway, and they can teach others to threaten cancellation. That’s why every save tactic needs a holdout group. The same logic drives incrementality testing in paid media: measure what an action caused, not what it claims.
What Is Churn Prediction, and Why Does It Often Fall Short?
Churn prediction uses past customer behavior to estimate who is likely to leave, and when. Models draw on usage, billing, support history, and customer feedback. Prediction often falls short because teams stop at the risk score. The value shows up only when a score triggers an action that changes what customers do.
Churn prediction rests on a simple idea. Customers who leave tend to show warning signs first. Usage drops, fewer people log in, support tickets pile up, or payments fail. A churn prediction system watches for those patterns and flags accounts before they cancel. Researchers who reviewed 212 published churn studies in 2024 found that models most often draw on demographic, usage, and behavioral data. Many also use customer feedback and social connections, according to the review in IEEE Access.
Good prediction also points to causes. McKinsey described a telecom operator that used a technique called feature discovery to find more than 50 variables tied to churn. Specific combinations of phone type, data usage, and call-center history reliably predicted that a customer would leave. The operator then held cross-functional workshops to trace those signals to root causes, such as problems at specific call centers and dropped calls.
Why Isn’t a Risk Score Enough?
A risk score is a list, and a list doesn’t keep anyone. McKinsey put it plainly: “true value is only realized when operators are able to change that behavior.” The IEEE Access review found that research on whether churn models make money remains thin. Its authors urged teams to judge models on profit, rather than on how well they sort customers.
Ascarza’s work shows why accuracy alone misleads. A model can rank customers by risk and still point the budget at the wrong people. Some high-risk customers will leave no matter what you do. Others would have stayed anyway. The customers worth targeting are the ones who change course when you act. Her research modeled both risk and lift, and targeting by lift cut churn more than targeting by risk, the AMA noted. The fix is to connect each score to an owner and an action, then measure what changed.
How Do You Build a Predictive Churn Model That Pays Off?
Build a predictive churn model in stages. Define churn and the warning window, assemble one record per customer, and start with simple rules before machine learning. Then estimate which customers will respond to each action. Connect every score to an owned play, and judge the model on revenue retained against a holdout group.
What Data Does a Churn Model Need?
The steps below tie the model to money from the start. The first three set up the data.
- Define the event and the window. Decide what counts as churn: a cancellation, a non-renewal, a downgrade below a set level, or a set stretch with no use. Then pick how far ahead to predict, leaving enough time to act.
- Build one record per customer. Join product usage, billing, support, CRM, and acquisition data on a single customer ID. Dan Barnes describes a source of truth where user state, acquisition source, revenue, and engagement are “all of it mapping back to a single user identity.”
- Segment before you model. Customers leave for different reasons. In one live engagement, our 360 Blueprint found unit economics that used a single flat LTV for every customer, regardless of motion or vertical. A churn model built on averages like that will miss the segments that matter.
How Do You Turn Scores Into Saved Revenue?
- Start simple. A rules-based health score built from a few signals gives teams something to act on while the data improves. McKinsey recommends a “crawl, walk, run” approach to building analytics around problems such as churn. Logistic regression and tree-based models are common next steps. One 2025 study tested seven algorithms on a 10,000-customer banking dataset and found gradient boosting showed the most promise, per its authors.
- Estimate lift as well as risk. Run small randomized tests of each retention action. Use the results to estimate who responds, then rank customers by expected revenue saved.
- Give every score an owner and a threshold. Each risk band should trigger a named play with a named owner and a clear point for escalation.
- Retrain on a schedule. Products, prices, and channels change, and models drift with them. Check the model against fresh cohorts, the same way our guide to calculating LTV:CAC checks LTV forecasts against actual results.
“One definition. One owner. One source of truth. And a threshold, not a target.” — Dan Barnes, President, MAVAN
How Do You Know the Model Is Working?
Judge it the way a CFO would. Compare churn and revenue between customers who got a retention action and a random holdout group with similar scores. If the treated group keeps more revenue, net of the offer’s cost, the model earns its keep. If not, the model may be accurate and still useless. Track the result monthly, by segment, next to gross and net revenue retention. Every retention effort shows up in those two numbers in the end.
What Is Net Revenue Retention, and How Do You Calculate It?
Net revenue retention measures how much recurring revenue a fixed group of customers produces a year later, after upgrades, downgrades, and cancellations. Divide that group’s current recurring revenue by its starting recurring revenue. Revenue from new customers stays out. A result above 100% means the existing customer base grew on its own.
The formula fits on one line:
NRR = (starting recurring revenue + expansion − contraction − churned revenue) ÷ starting recurring revenue
SaaS Capital, a lender to SaaS companies that runs an annual benchmark survey, defines it with a December snapshot. It takes monthly recurring revenue this December from customers who were customers last December. Then it divides by total monthly recurring revenue last December, according to its 2025 retention benchmarks.
Here’s how the math works. A company starts the year with $1,000,000 in annual recurring revenue (ARR) from existing customers. Over 12 months, those customers add $150,000 through upgrades and new seats. Others downgrade by $40,000, and cancellations remove $90,000. The cohort ends the year at $1,020,000, so NRR is 102%. Gross revenue retention (GRR) uses the same math without the $150,000 in expansion, so it comes to 87%.
Why Should NRR Never Travel Alone?
That example shows the trap. An NRR of 102% looks healthy. A GRR of 87% says the company lost 13% of its starting revenue and covered the hole with upsells. SaaS Capital describes churn as roughly one minus gross retention, and notes that net retention always runs higher than gross.
Bain’s April 2026 software report adds a second caution. AI products are moving pricing from seats toward usage and outcomes, which makes revenue burstier. Bain wrote that ARR and NRR “were reliable proxies for value” when software moats were more durable. Today, it says, traditional SaaS signals are increasingly misleading in diligence. The answer isn’t to drop NRR. It’s to show what sits underneath it: GRR, cohort curves, and how much expansion comes from real usage.
What Is a Good Net Revenue Retention Rate for SaaS?
A good net revenue retention rate for SaaS depends on contract size. SaaS Capital’s 2025 survey put the median for private B2B companies at 101%, with gross retention at 91%. Firms with $25,000 to $50,000 contracts showed a 102% median and a 111% top quartile. Higher contract values tend to bring higher retention.
| Benchmark | Figure | Source |
| Median NRR, private B2B SaaS | 101% | SaaS Capital, 2025 |
| Median GRR, private B2B SaaS | 91% | SaaS Capital, 2025 |
| Median NRR, $25K to $50K contracts | 102% (top quartile: 111%) | SaaS Capital, 2025 |
| Expansion share of new ARR | 40% (over 50% above $50M ARR) | Benchmarkit, 2025 |
| Software NRR change since 2021 | Down about 8 points | Bain & Company, 2026 |
| Median revenue multiple, NRR above 120% | 9.3x (3.1x below 100% NRR) | Software Equity Group, 2Q24 |
The median leaves little room to spare. At 101%, the typical private B2B SaaS company barely grows from its existing base. SaaS Capital’s data shows why that matters. Across companies with more than $1 million in ARR, median growth was 24%. Groups with NRR of at least 110% grew faster than that median, and companies below 100% grew slower. SaaS Capital calls the link between NRR and growth strong and exponential.
Investors read it the same way. The 2025 SaaS Benchmarks report from High Alpha and Growth Unhinged named CAC payback period and NRR as the two strongest predictors of long-term, profitable growth, Kyle Poyar wrote. Public markets agree. In Software Equity Group’s second-quarter 2024 analysis, public software companies with NRR above 120% traded at a median 9.3 times revenue. Those below 100% traded at 3.1 times.
How Should Consumer and On-Demand Companies Read It?
NRR was built for contracts and seats. Consumer subscriptions, marketplaces, and on-demand apps need a version that fits how their customers buy. Two changes help. First, give failed payments more weight at lower price points. Recurly’s network data shows involuntary churn falls sharply as revenue per customer rises, so it makes up a larger share of churn in low-price subscriptions.
Second, track revenue by cohort over time. Barnes recommends cohort revenue trajectory, meaning what a month’s acquired cohort is worth at 30, 60, and 90 days compared with earlier cohorts. “That’s your real growth signal,” he says. In a marketplace with no contracts, that curve does the job NRR does in SaaS.
Why Does Retention Decide Returns for PE-Backed Companies?
For PE sponsors, retention turns into revenue growth, EBITDA, and exit value. Kept revenue costs little to serve, and it compounds through the hold. With deals now needing 10% to 12% annual EBITDA growth, a leaky customer base is hard to outrun. Buyers also probe retention closely in diligence, so cohort proof matters at exit.
The math in PE has tightened. Typical deals now need about 10% to 12% average annual EBITDA growth to earn a 2.5x return over five years. That’s the finding of Bain & Company’s 2026 Global Private Equity Report. A decade ago, about 5% did the job. Bain sums it up as “12 is the new 5.” Its midyear update counted about 33,000 unsold portfolio companies. Average holds now run about seven years, The Consulting Report noted. Every year of that hold compounds whatever retention a company has, good or bad.
Retention is also where growth and margin meet. A retained customer needs no new media spend and no new sales cycle. Benchmarkit found PE-backed SaaS companies spend about 33% of revenue on sales and marketing, compared with 47% at VC-funded peers. Leaner go-to-market budgets put more weight on the customers a company already serves.
What Do Buyers Look for at Exit?
Buyers now look past the headline number. Bain’s software team wrote that traditional SaaS signals, NRR included, are increasingly misleading in diligence on their own. Its advice centered on AI claims, asking whether a company can show proof points. In our view, the same standard now applies to retention. A sponsor heading to exit should be able to show GRR and NRR by cohort, explain each cohort’s curve, and tie retention gains to specific changes.
Our guide to growth and GTM due diligence covers how buyers test retention against the deal model. A companion piece on accelerating revenue and EBITDA after an acquisition shows where retention fits in the plan.
How Can a Fund Make Retention Repeatable?
Funds hold many companies, and each one tends to define churn its own way. That makes portfolio companies hard to compare, and it makes what works harder to spread. The answer is a standard: one churn definition, one cohort view, one scoreboard format, and one diagnostic. When every portco reports retention the same way, operating partners can spot which companies are slipping and move help there early. Learning from one company then carries into the next.
How Does MAVAN Build Retention Systems That Last?
We treat retention as part of the whole growth system. Every engagement starts with a Blueprint: 28 days, 5+ MAVAN specialists, and full access to the company’s platforms, people, and data. It shows where customers leave and why. Embedded operators then fix the causes across functions and leave the system with the company’s team.
MAVAN is a growth operating company. We diagnose what will move the business, embed the operators needed to do the work, and leave the company with stronger systems. Lifecycle and retention is one of our 12 core growth functions, but churn rarely stays inside one function. So the Blueprint tests the whole system first. It covers data and infrastructure, go-to-market architecture, organizational dynamics, and the priorities the company already holds. Every finding is evidenced. If we can’t show the number behind it, it doesn’t go in.
The roadmap sorts every action by who has to move it. “We start now” items are inside our control and begin in week one, such as a broken lifecycle trigger. “Needs a decision” items, such as a pause option or a pricing change, wait on leadership or the board. “Needs a session” items, such as aligning product and marketing on the first-value moment, need the right people in a room. A sequencing register names the risks, like a data rebuild that has to land before a churn model can work.
What Happens After the Diagnosis?
NEXUS is our human-augmented paid media analytics platform. It connects the ad platforms, the mobile measurement partner, and the warehouse into one view of acquisition performance, with an AI insight layer on top. NEXUS is included with the 360 Blueprint. That shared view helps teams see which channels bring in customers who stay. From there, operators drawn from our network of 170+ specialists work inside the company’s tools and meetings. They document the system so the internal team can run it after we leave.
What Results Has This Approach Produced?
Lifecycle work sits at the center of our retention proof. For Arcadia, a fast-growing climate-tech company, we built and optimized an end-to-end lifecycle program. Email open rates rose 47%, engagement rose 60%, and 38% of revenue was attributed to the program. For WGT, a Haveli Investments company, the work moved from Blueprint to paid acquisition, then to a lifecycle rebuilt end to end, then to the data and analytics stack.
At Uniform Teeth, we moved lead management into a modern CRM with segmentation and automated follow-up. Lifecycle-attributed sales rose 45%, with more than $3.7 million in active leads managed. For Pantaya, a Spanish-language streaming service once owned by Lionsgate, buy-flow tests lifted conversion to subscriptions 5% and cut churn among prospective subscribers by 10%. More results live on our case studies page.
Frequently Asked Questions About Retention and Churn
These are the follow-up questions we hear most from operating partners, portco leaders, and growth teams. They cover churn benchmarks, health scores, machine learning, discounts, and which retention metric matters most. Each answer stands on its own, so teams can share the one that fits their next meeting.
What Is a Good Churn Rate?
It depends on price point and contract size, so compare yourself with peers who sell at a similar price. For private B2B SaaS, SaaS Capital’s 2025 data implies median annual revenue churn of about 9%. It puts median gross retention at 91% and treats churn as roughly one minus gross retention. Low-price consumer subscriptions tend to run higher, partly because more customers lose access through failed payments.
What Is the Difference Between a Health Score and a Predictive Churn Model?
A health score uses rules that people set, such as weights for logins, support tickets, and payment status. Predictive churn models learn those weights from past customer data. Many teams start with a health score and move to a model as their data improves. Both need an owner and a planned action to change anything.
Do You Need Machine Learning to Predict Churn?
No. Simple rules and cohort curves can catch many early warning signs, and teams find them easier to trust. McKinsey recommends a “crawl, walk, run” approach to analytics built around specific problems like churn. Add machine learning once your customer data is joined, clean, and trusted.
Should You Offer Discounts to Customers Who Want to Cancel?
Test before you commit. When customers leave because they don’t see value, Recurly recommends usage nudges and onboarding over discount-led saves. A pause or downgrade option may keep more revenue. Whatever you offer, run it against a holdout group so you can see the revenue it actually saves.
Which Matters More, NRR or GRR?
Read them together. GRR shows how much revenue you lose. NRR shows whether expansion outruns that loss. A strong NRR next to a weak GRR means upsells are covering churn, and buyers will spot it in diligence.
Where Should You Start With Customer Retention?
Start by sorting your churn: cancellations versus failed payments, customers versus revenue, and one cohort versus the next. Recover failed payments first. Then fix the first-value moment, rebuild lifecycle around behavior, and aim saves at customers who will respond. Track GRR and NRR together, from one source of truth, every month.
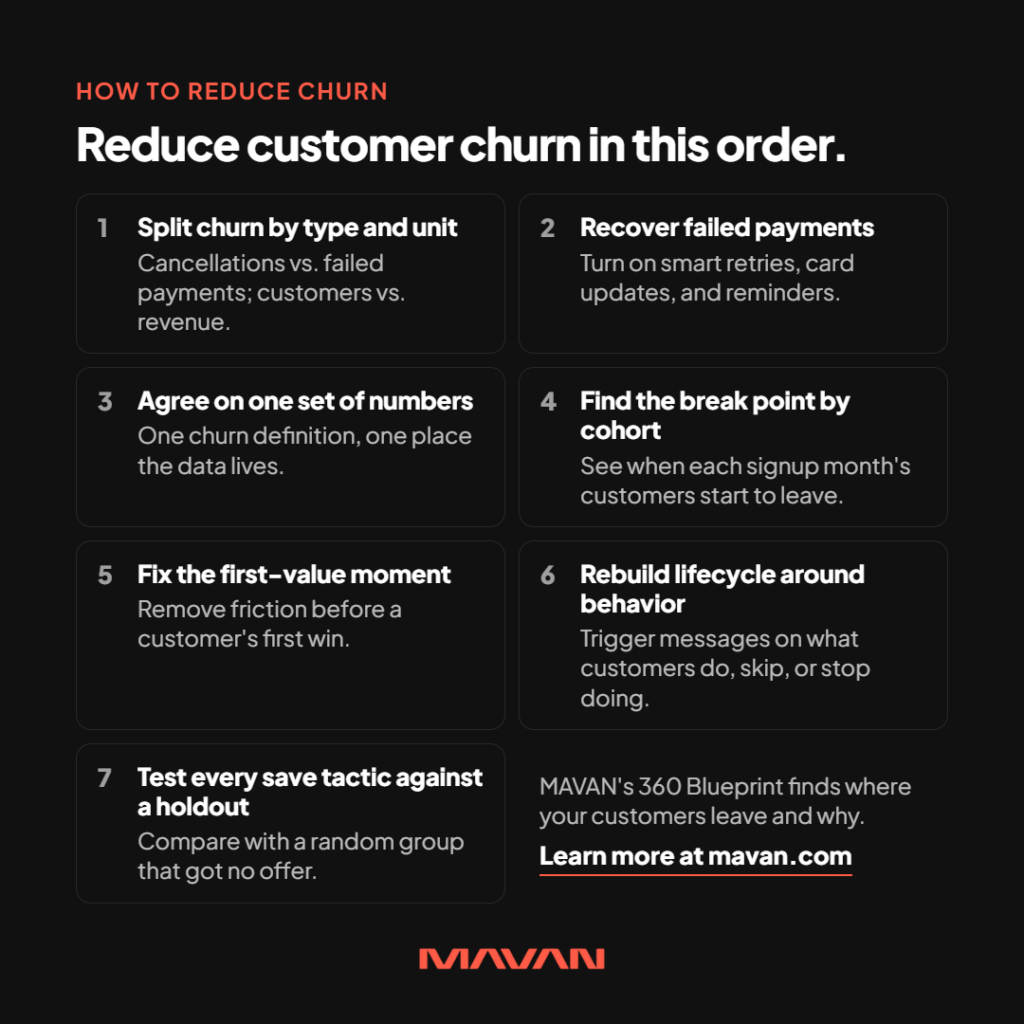
Most companies we meet don’t lack retention ideas. They lack a clear answer on where customers leave, why, and which fix should come first. That’s the gap a Blueprint closes. In four weeks, our team works inside your platforms, people, and data. We trace churn to its causes, check whether your retention numbers agree, and show which fixes to run first. You leave with evidenced findings and a roadmap sorted by who has to move each action. Your team can run it alone, or with MAVAN’s operators alongside.
Request a Blueprint to find where your customers leave and why.
Casey Rock is Content Director at MAVAN, where he helps turn complex ideas into clear, strategic content that drives growth. With over 15 years of experience across content strategy, SEO, media, and digital marketing, Casey focuses on building content systems that connect audience insight, brand storytelling, and measurable business outcomes.
Book a complimentary consultation with one of our experts
to learn how MAVAN can help your business grow.
Want more growth insights?
[hubspot type=”form” portal=”20951211″ id=”9c538ed2-fb12-45f1-a573-ad7953c058cc”]
Related Content
-
What Customer Retention Strategies Actually Reduce Churn?
The customer retention strategies that reduce churn start before the renewal date. Keep the promise that won each customer, shorten the path to first value, and recover failed payments. Then trigger lifecycle messages on behavior, aim saves at customers who will respond, and track net revenue retention by cohort from one source of truth.
-
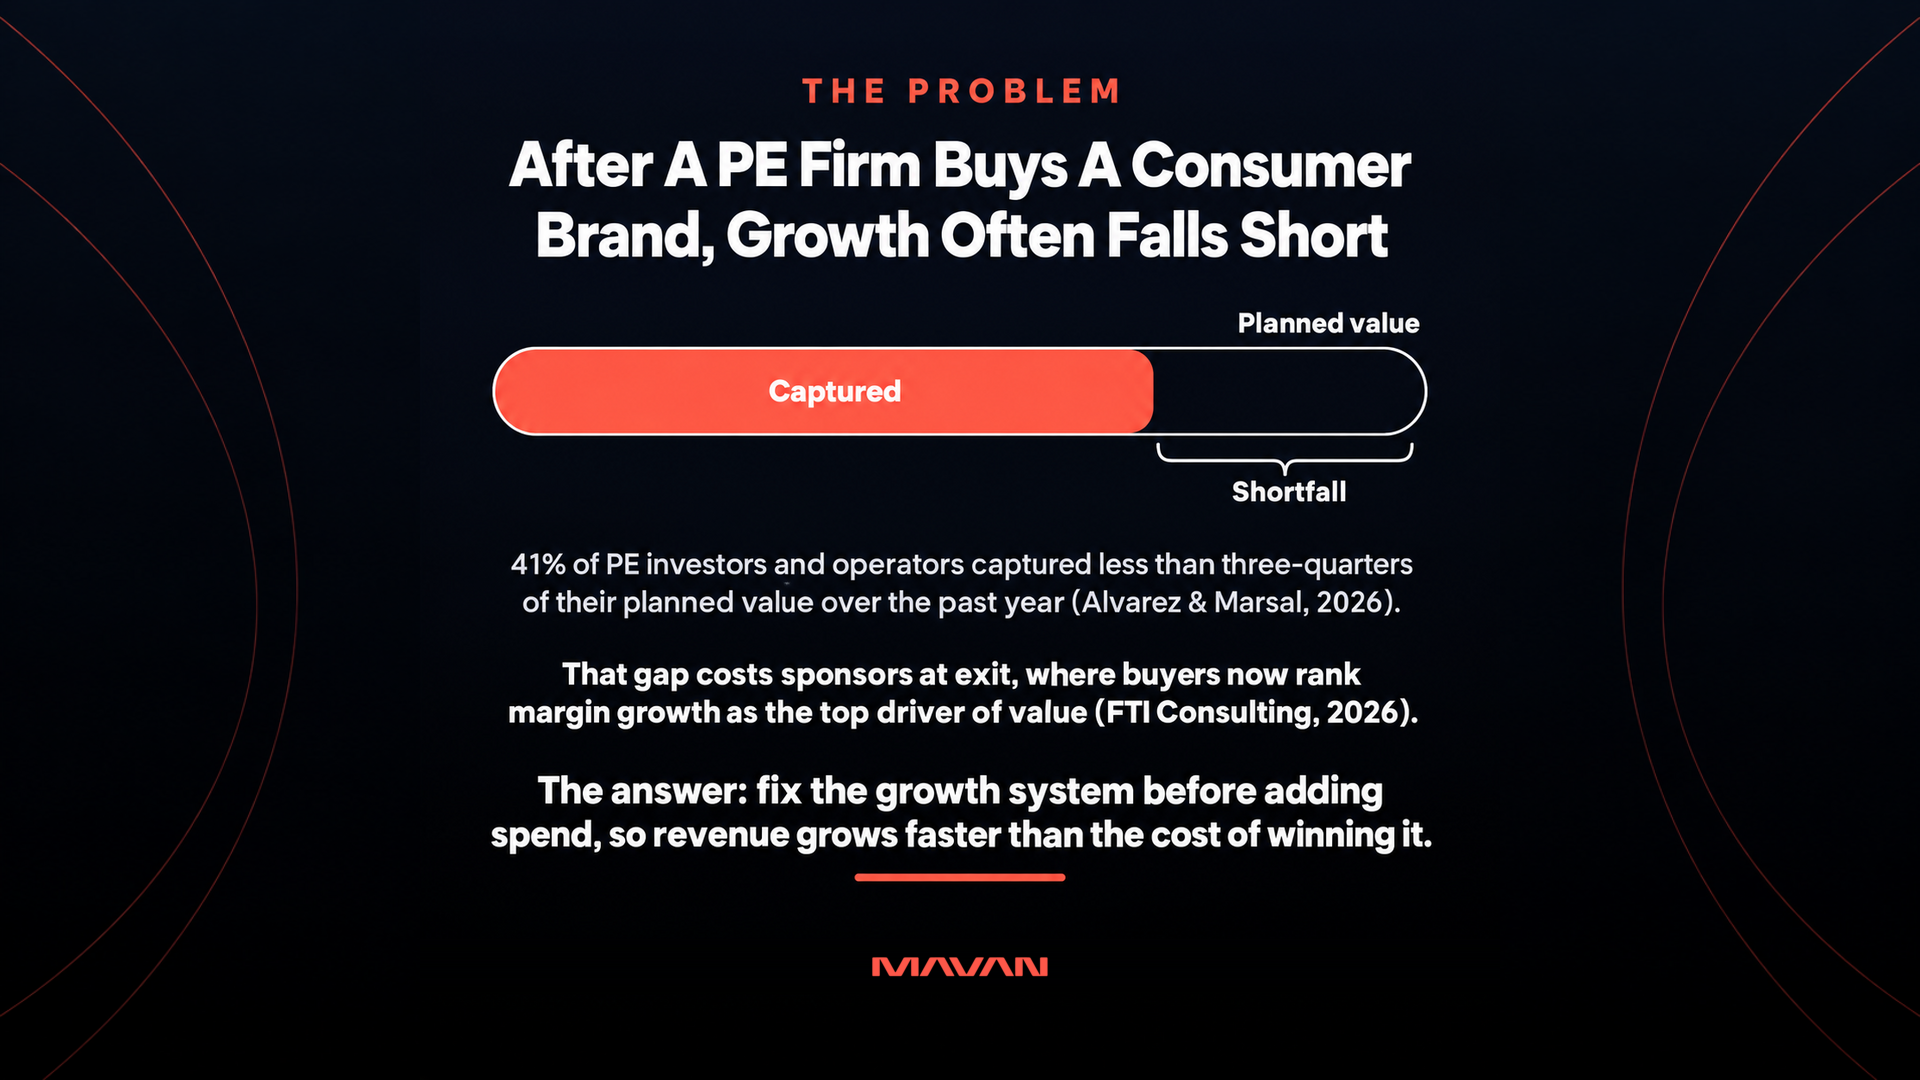
How Do PE Firms Accelerate Revenue And EBITDA Post-Acquisition?
PE firms accelerate revenue and EBITDA at consumer brands by fixing the growth system before adding spend. They reconcile the numbers and cut spend that never pays back. They lift conversion and repeat purchases, and they judge growth by contribution margin. Growth operating partners such as MAVAN diagnose that system in 28 days, then help execute the fix.
-
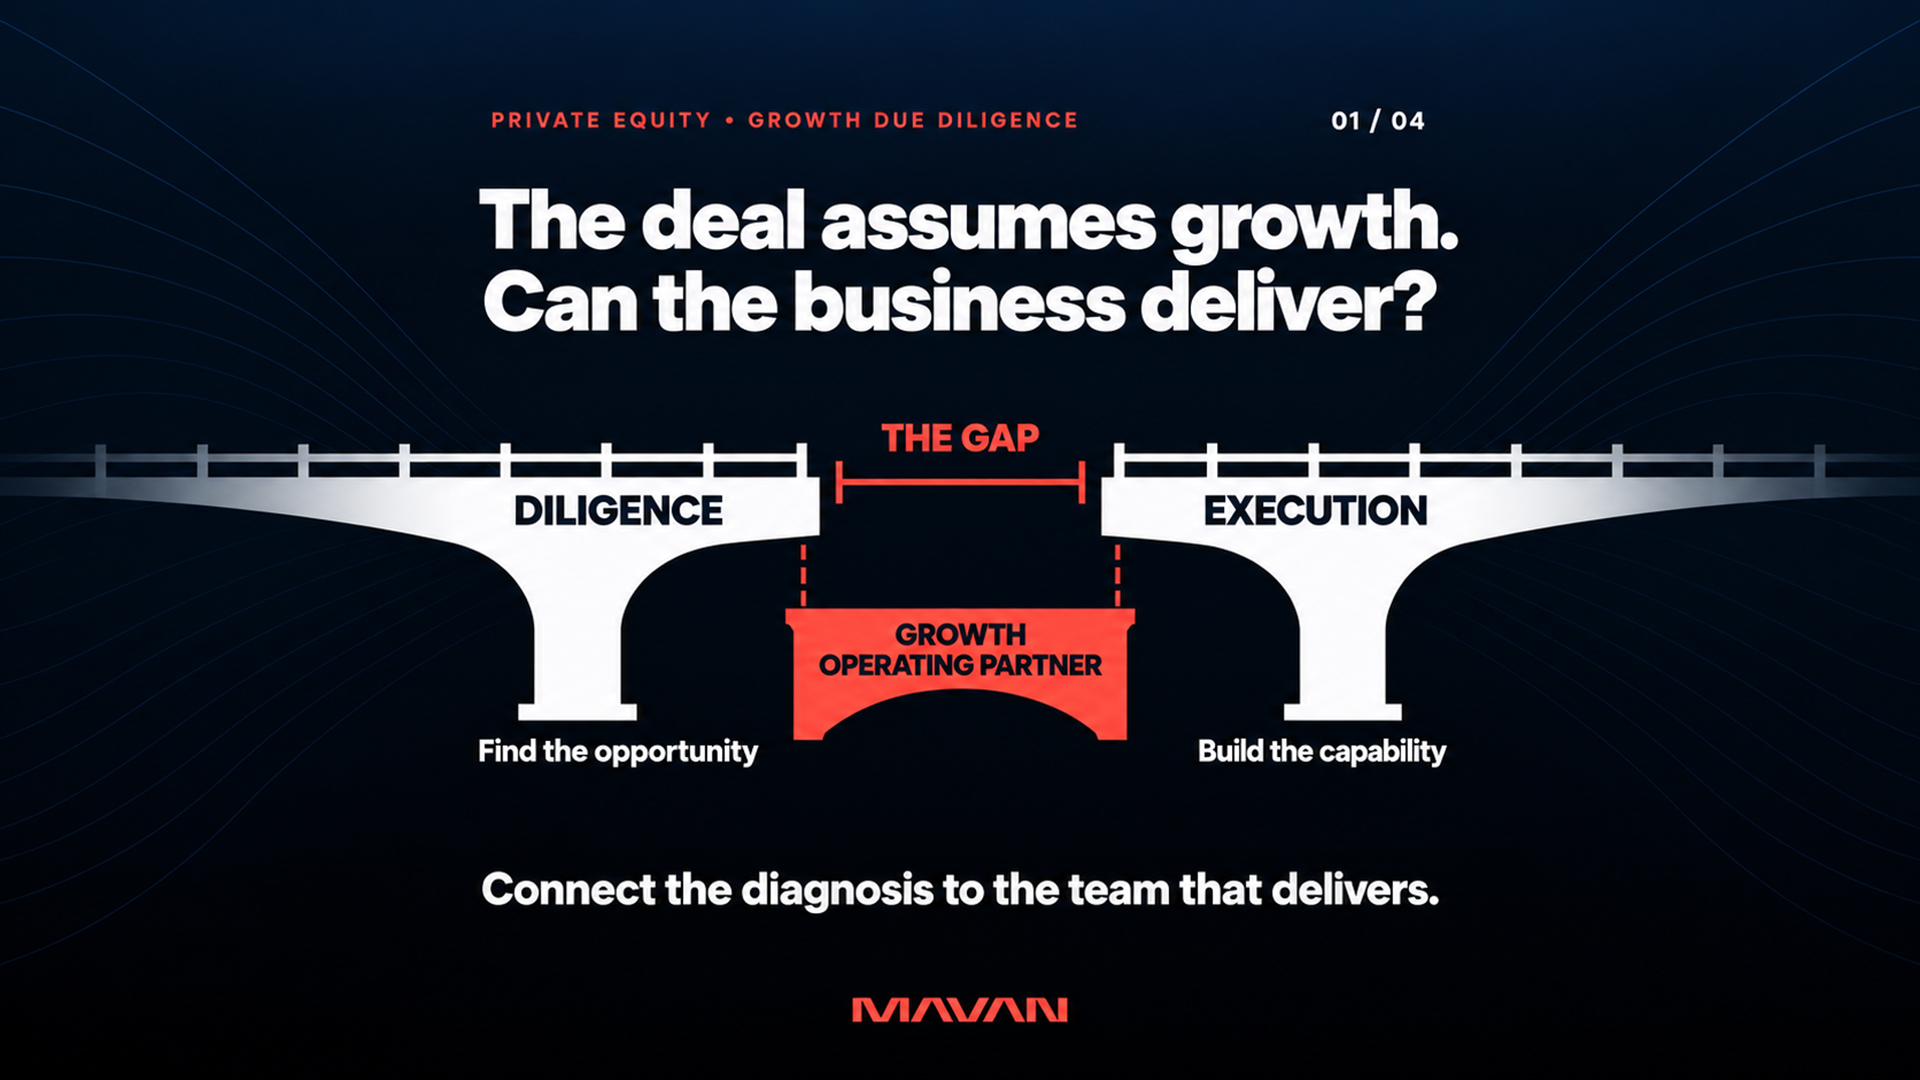
Who Does Growth & GTM Due Diligence for PE Deals?
Four kinds of provider run growth and go-to-market due diligence for private equity deals. Strategy consultancies test the market. Specialist commercial diligence firms audit the pipeline. Go-to-market boutiques rebuild the sales motion. And growth operating partners examine the full revenue engine from inside the business, then stay to operate it after close.